## Diagram: Configurations of W^u and H^u Across Methods and Types
### Overview
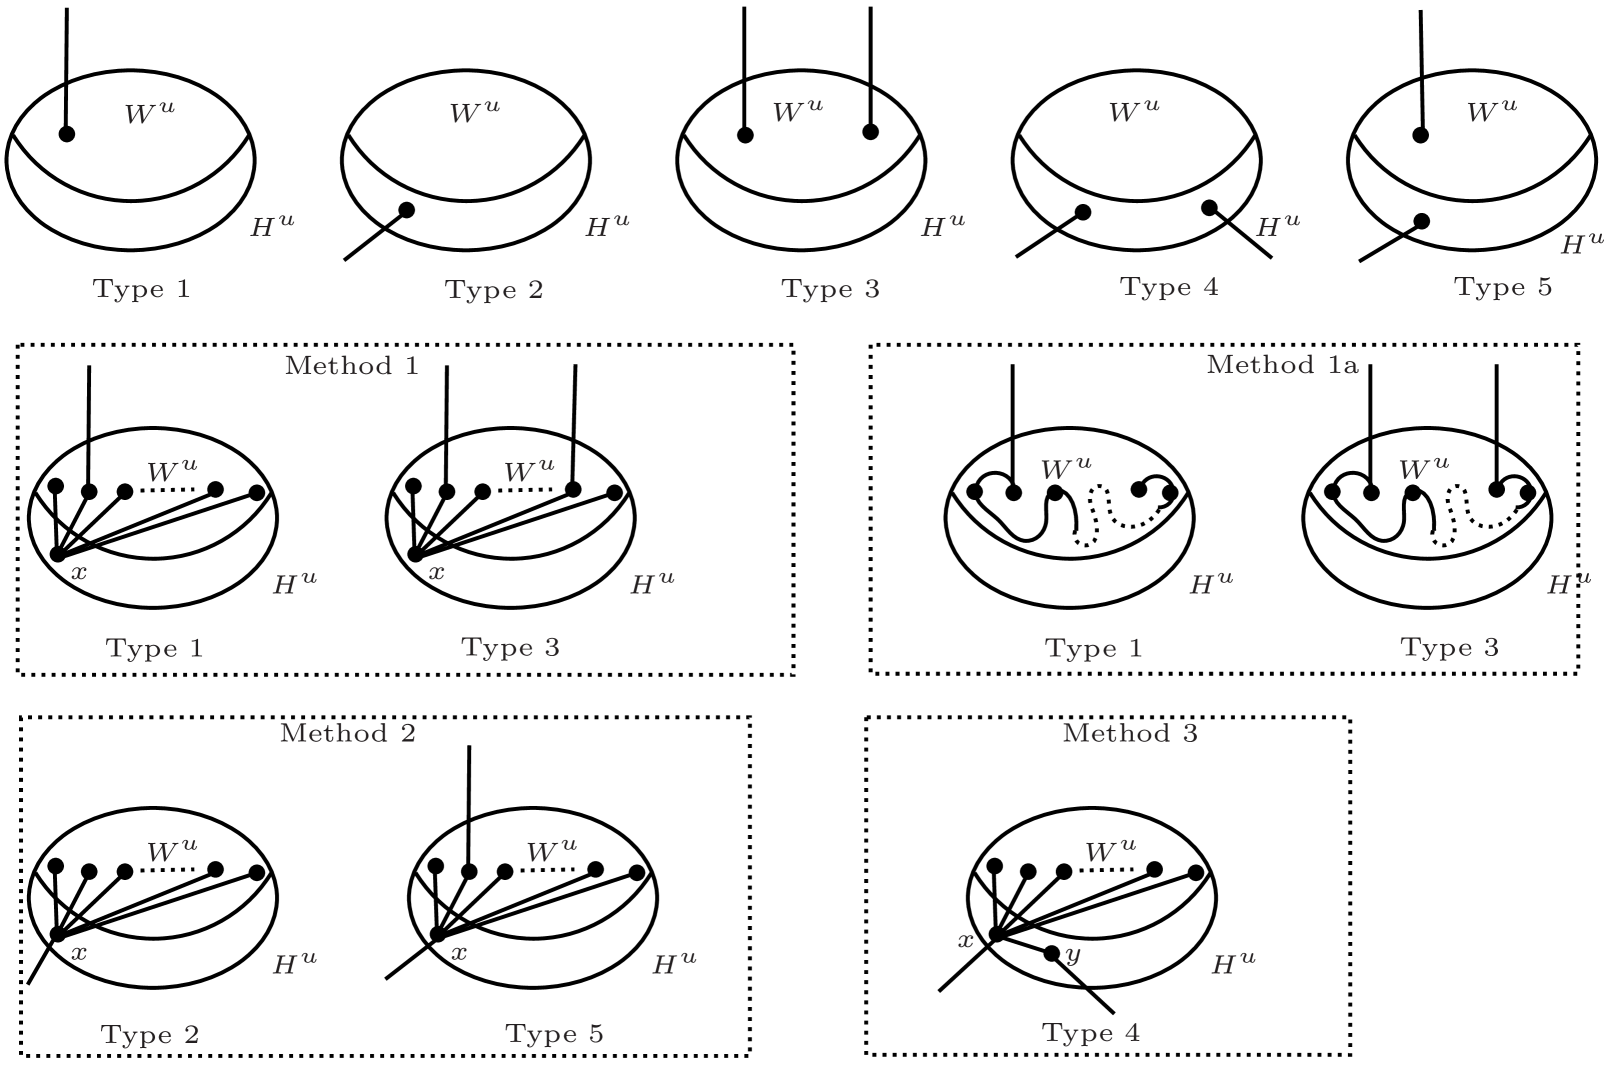
The image presents a technical diagram illustrating five distinct configurations (Type 1–Type 5) of two sets, **W^u** (upper set) and **H^u** (lower set), connected by lines. Below these, three methods (Method 1, Method 2, Method 3) and a sub-method (Method 1a) are depicted, each combining specific types with unique line arrangements. The diagram uses black lines, dotted lines, and labeled points (e.g., **x**, **y**) to represent relationships.
---
### Components/Axes
1. **Primary Diagrams (Top Row)**:
- **Type 1**: Single point on **W^u** (top) and **H^u** (bottom), connected by a vertical line.
- **Type 2**: Two points on **W^u**, connected by a horizontal line; one point on **H^u** below.
- **Type 3**: Two points on **W^u** (top) and one on **H^u** (bottom), with lines connecting **W^u** points to **H^u**.
- **Type 4**: Two points on **W^u** and two on **H^u**, with cross-connections between **W^u** and **H^u**.
- **Type 5**: One point on **W^u** and two on **H^u**, with lines connecting **W^u** to both **H^u** points.
2. **Method Boxes (Bottom Section)**:
- **Method 1**: Combines Type 1 (left) and Type 3 (right), with solid lines.
- **Method 1a**: Similar to Method 1 but uses dotted lines for connections.
- **Method 2**: Combines Type 2 (left) and Type 5 (right), with solid lines.
- **Method 3**: Single diagram (Type 4) with a new point **y** connected to **x** via a dashed line.
3. **Labels**:
- **W^u**: Consistently placed at the top of all diagrams.
- **H^u**: Positioned at the bottom of all diagrams.
- **x**, **y**: Points labeled in specific configurations (e.g., Method 3, Type 4).
---
### Detailed Analysis
- **Type 1**: Minimal configuration with one point per set. Vertical alignment suggests a direct relationship.
- **Type 2**: Two **W^u** points imply a binary interaction; **H^u** acts as a terminal node.
- **Type 3**: Introduces multiple **W^u** points connected to a single **H^u**, indicating a many-to-one relationship.
- **Type 4**: Complex cross-connections between **W^u** and **H^u** points, suggesting a networked structure.
- **Type 5**: Reverses the hierarchy, with **H^u** dominating (**H^u** has two points vs. one **W^u**).
- **Method 1a**: Dotted lines in Type 1 and Type 3 may represent hypothetical or alternative pathways.
- **Method 3**: Introduces **y** as a new variable, connected to **x** via a dashed line, possibly denoting an indirect or secondary relationship.
---
### Key Observations
1. **Hierarchical Variation**: Types 1–5 show increasing complexity, from simple vertical connections (Type 1) to networked structures (Type 4/5).
2. **Method Differentiation**:
- **Method 1a** (dotted lines) contrasts with **Method 1** (solid lines), possibly indicating uncertainty or alternative hypotheses.
- **Method 3** introduces **y**, expanding the system beyond previous configurations.
3. **Spatial Consistency**: **W^u** and **H^u** are always vertically aligned, reinforcing their roles as distinct sets.
---
### Interpretation
The diagram likely models a system where **W^u** and **H^u** represent distinct entities (e.g., variables, states, or components) with varying interaction patterns. The methods suggest different analytical or operational approaches:
- **Method 1/1a**: Focus on foundational or alternative configurations.
- **Method 2**: Emphasizes binary and reversed-hierarchy interactions.
- **Method 3**: Introduces a new variable (**y**), hinting at expanded scope or emergent behavior.
The use of dotted/dashed lines in **Method 1a** and **Method 3** may signal provisional or secondary relationships, requiring further validation. The progression from Type 1 to Type 5 reflects a spectrum of complexity, potentially mapping stages of a process or scenarios in a decision-making framework.