## Line Charts: Validation Loss vs. Tokens Seen
### Overview
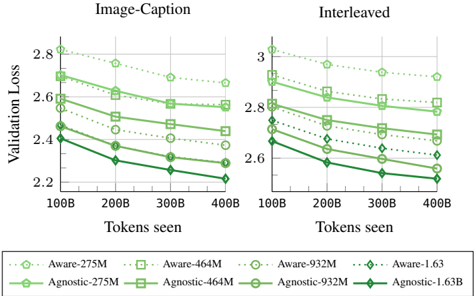
The image presents two line charts comparing the validation loss of "Aware" and "Agnostic" models with varying parameter sizes (275M, 464M, 932M, and 1.63B) against the number of tokens seen during training. The left chart is labeled "Image-Caption," and the right chart is labeled "Interleaved." Both charts share the same x and y axes, allowing for a direct comparison of the models' performance under different training conditions.
### Components/Axes
* **Titles:** "Image-Caption" (left chart), "Interleaved" (right chart)
* **Y-axis Label:** "Validation Loss"
* Scale: 2.2 to 2.8 for "Image-Caption", 2.6 to 3.0 for "Interleaved"
* **X-axis Label:** "Tokens seen"
* Scale: 100B, 200B, 300B, 400B
* **Legend:** Located at the bottom of the image.
* Aware-275M (light green, dotted line, circle marker)
* Aware-464M (light green, dotted line, square marker)
* Aware-932M (light green, dotted line, no marker)
* Aware-1.63 (light green, dotted line, diamond marker)
* Agnostic-275M (dark green, solid line, circle marker)
* Agnostic-464M (dark green, solid line, square marker)
* Agnostic-932M (dark green, solid line, no marker)
* Agnostic-1.63B (dark green, solid line, diamond marker)
### Detailed Analysis
#### Image-Caption Chart
* **Aware-275M:** (light green, dotted line, circle marker) Starts at approximately 2.8, decreases to about 2.7 by 400B tokens.
* **Aware-464M:** (light green, dotted line, square marker) Starts at approximately 2.7, decreases to about 2.65 by 400B tokens.
* **Aware-932M:** (light green, dotted line, no marker) Starts at approximately 2.6, decreases to about 2.5 by 400B tokens.
* **Aware-1.63:** (light green, dotted line, diamond marker) Starts at approximately 2.45, decreases to about 2.4 by 400B tokens.
* **Agnostic-275M:** (dark green, solid line, circle marker) Starts at approximately 2.6, decreases to about 2.4 by 400B tokens.
* **Agnostic-464M:** (dark green, solid line, square marker) Starts at approximately 2.5, decreases to about 2.3 by 400B tokens.
* **Agnostic-932M:** (dark green, solid line, no marker) Starts at approximately 2.4, decreases to about 2.25 by 400B tokens.
* **Agnostic-1.63B:** (dark green, solid line, diamond marker) Starts at approximately 2.45, decreases to about 2.2 by 400B tokens.
#### Interleaved Chart
* **Aware-275M:** (light green, dotted line, circle marker) Starts at approximately 3.05, decreases to about 2.9 by 400B tokens.
* **Aware-464M:** (light green, dotted line, square marker) Starts at approximately 2.9, decreases to about 2.8 by 400B tokens.
* **Aware-932M:** (light green, dotted line, no marker) Starts at approximately 2.8, decreases to about 2.7 by 400B tokens.
* **Aware-1.63:** (light green, dotted line, diamond marker) Starts at approximately 2.7, decreases to about 2.6 by 400B tokens.
* **Agnostic-275M:** (dark green, solid line, circle marker) Starts at approximately 2.7, decreases to about 2.5 by 400B tokens.
* **Agnostic-464M:** (dark green, solid line, square marker) Starts at approximately 2.7, decreases to about 2.45 by 400B tokens.
* **Agnostic-932M:** (dark green, solid line, no marker) Starts at approximately 2.6, decreases to about 2.35 by 400B tokens.
* **Agnostic-1.63B:** (dark green, solid line, diamond marker) Starts at approximately 2.65, decreases to about 2.2 by 400B tokens.
### Key Observations
* In both charts, the "Agnostic" models generally exhibit lower validation loss compared to the "Aware" models for a given parameter size.
* Larger parameter sizes (1.63B) tend to result in lower validation loss compared to smaller parameter sizes (275M, 464M, 932M) for both "Aware" and "Agnostic" models.
* The "Interleaved" training method generally results in higher validation loss compared to the "Image-Caption" training method for both "Aware" and "Agnostic" models.
* The validation loss decreases as the number of tokens seen increases for all models and training methods.
### Interpretation
The data suggests that "Agnostic" models are more effective than "Aware" models in terms of validation loss, indicating better generalization performance. Increasing the parameter size of the models also improves performance, as expected. The "Image-Caption" training method appears to be more effective than the "Interleaved" method, possibly due to the nature of the training data or the learning dynamics induced by the different training approaches. The decreasing validation loss with more tokens seen indicates that the models are learning and improving their performance as they are exposed to more data. The "Agnostic-1.63B" model trained with the "Image-Caption" method achieves the lowest validation loss, suggesting it is the most effective configuration among those tested.