\n
## Chart: Validation Loss vs. Tokens Seen
### Overview
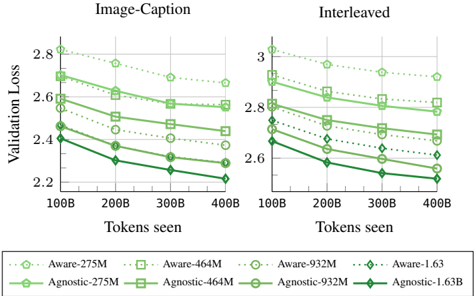
The image presents two line charts comparing validation loss against tokens seen for different model configurations. The left chart is labeled "Image-Caption" and the right chart is labeled "Interleaved". Each chart displays multiple lines representing different models, with the legend at the bottom identifying each line by model name and size (in millions or billions of parameters).
### Components/Axes
* **X-axis:** "Tokens seen", ranging from 100B to 400B, with markers at 100B, 200B, 300B, and 400B.
* **Y-axis (Left Chart):** "Validation Loss", ranging from 2.2 to 2.9, with markers at 2.2, 2.4, 2.6, and 2.8.
* **Y-axis (Right Chart):** "Validation Loss", ranging from 2.5 to 3.1, with markers at 2.6, 2.8, and 3.0.
* **Legend:** Located at the bottom of the image, containing the following model configurations:
* Aware-275M (light green, dashed)
* Agnostic-275M (dark green, solid)
* Aware-464M (light green, dash-dot)
* Agnostic-464M (dark green, dashed-dot)
* Aware-932M (light green, dotted)
* Agnostic-932M (dark green, solid-dotted)
* Aware-1.63 (light green, solid)
* Agnostic-1.63B (dark green, solid)
### Detailed Analysis or Content Details
**Image-Caption Chart (Left):**
* **Aware-275M:** Starts at approximately 2.85, decreases to approximately 2.65 at 200B, then fluctuates around 2.6 to 2.7, ending at approximately 2.6.
* **Agnostic-275M:** Starts at approximately 2.8, decreases to approximately 2.55 at 200B, then decreases to approximately 2.45 at 300B, and ends at approximately 2.4.
* **Aware-464M:** Starts at approximately 2.8, decreases to approximately 2.6 at 200B, then decreases to approximately 2.55 at 300B, and ends at approximately 2.5.
* **Agnostic-464M:** Starts at approximately 2.75, decreases to approximately 2.55 at 200B, then decreases to approximately 2.5 at 300B, and ends at approximately 2.5.
* **Aware-932M:** Starts at approximately 2.75, decreases to approximately 2.55 at 200B, then decreases to approximately 2.45 at 300B, and ends at approximately 2.4.
* **Agnostic-932M:** Starts at approximately 2.7, decreases to approximately 2.5 at 200B, then decreases to approximately 2.4 at 300B, and ends at approximately 2.35.
* **Aware-1.63:** Starts at approximately 2.7, decreases to approximately 2.45 at 200B, then decreases to approximately 2.3 at 300B, and ends at approximately 2.25.
* **Agnostic-1.63B:** Starts at approximately 2.65, decreases to approximately 2.4 at 200B, then decreases to approximately 2.3 at 300B, and ends at approximately 2.2.
**Interleaved Chart (Right):**
* **Aware-275M:** Starts at approximately 3.0, decreases to approximately 2.85 at 200B, then fluctuates around 2.8 to 2.9, ending at approximately 2.8.
* **Agnostic-275M:** Starts at approximately 3.0, decreases to approximately 2.8 at 200B, then decreases to approximately 2.75 at 300B, and ends at approximately 2.7.
* **Aware-464M:** Starts at approximately 3.0, decreases to approximately 2.8 at 200B, then decreases to approximately 2.7 at 300B, and ends at approximately 2.7.
* **Agnostic-464M:** Starts at approximately 2.95, decreases to approximately 2.75 at 200B, then decreases to approximately 2.7 at 300B, and ends at approximately 2.7.
* **Aware-932M:** Starts at approximately 2.95, decreases to approximately 2.75 at 200B, then decreases to approximately 2.65 at 300B, and ends at approximately 2.6.
* **Agnostic-932M:** Starts at approximately 2.9, decreases to approximately 2.7 at 200B, then decreases to approximately 2.6 at 300B, and ends at approximately 2.55.
* **Aware-1.63:** Starts at approximately 2.9, decreases to approximately 2.65 at 200B, then decreases to approximately 2.5 at 300B, and ends at approximately 2.4.
* **Agnostic-1.63B:** Starts at approximately 2.85, decreases to approximately 2.6 at 200B, then decreases to approximately 2.5 at 300B, and ends at approximately 2.4.
### Key Observations
* In both charts, all models exhibit a decreasing trend in validation loss as the number of tokens seen increases. This indicates that the models are learning and improving with more data.
* The larger models (Aware-1.63 and Agnostic-1.63B) consistently achieve lower validation loss compared to the smaller models.
* The "Agnostic" models generally perform slightly better than the "Aware" models, particularly at higher token counts.
* The rate of loss reduction appears to slow down as the number of tokens seen increases, suggesting diminishing returns from further training.
### Interpretation
The charts demonstrate the impact of model size and training data on validation loss. Larger models, with more parameters, are capable of achieving lower validation loss, indicating better generalization performance. The "Agnostic" models' slight advantage suggests that their architecture or training procedure may be more effective. The decreasing trend in validation loss with increasing tokens seen confirms the importance of data in model training. The flattening of the curves at higher token counts suggests that there is a point of diminishing returns, where adding more data does not significantly improve performance. These results are crucial for understanding the trade-offs between model size, training data, and performance, and for optimizing model training strategies. The two charts, "Image-Caption" and "Interleaved", show similar trends, suggesting that the observed effects are consistent across different training paradigms.