## Bar Chart: SHD Test Accuracy vs. Total Recurrent Neurons
### Overview
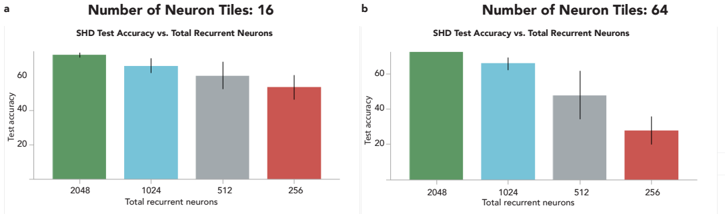
The image presents two bar charts comparing SHD (Spiking Heidelberg Digits) test accuracy against the total number of recurrent neurons. Chart (a) displays results for 16 neuron tiles, while chart (b) shows results for 64 neuron tiles. Each chart compares the test accuracy for 2048, 1024, 512, and 256 total recurrent neurons. Error bars are included on each bar, indicating the variability in the test accuracy.
### Components/Axes
* **Chart Titles:**
* (a) Number of Neuron Tiles: 16
* (b) Number of Neuron Tiles: 64
* **Y-axis Title:** Test accuracy
* **Y-axis Scale:** 0 to 60, with no explicit markings, but implied increments of 20.
* **X-axis Title:** Total recurrent neurons
* **X-axis Categories:** 2048, 1024, 512, 256
* **Bar Colors:** Green (2048), Light Blue (1024), Gray (512), Red (256)
### Detailed Analysis
**Chart (a): Number of Neuron Tiles: 16**
* **2048 Neurons (Green):** Test accuracy is approximately 68% with a small error bar.
* **1024 Neurons (Light Blue):** Test accuracy is approximately 64% with a small error bar.
* **512 Neurons (Gray):** Test accuracy is approximately 59% with a moderate error bar.
* **256 Neurons (Red):** Test accuracy is approximately 53% with a moderate error bar.
**Chart (b): Number of Neuron Tiles: 64**
* **2048 Neurons (Green):** Test accuracy is approximately 68% with a small error bar.
* **1024 Neurons (Light Blue):** Test accuracy is approximately 64% with a small error bar.
* **512 Neurons (Gray):** Test accuracy is approximately 47% with a large error bar.
* **256 Neurons (Red):** Test accuracy is approximately 27% with a moderate error bar.
### Key Observations
* In both charts, the test accuracy generally decreases as the number of total recurrent neurons decreases from 2048 to 256.
* The test accuracy for 2048 and 1024 neurons is nearly identical between the 16 and 64 neuron tile configurations.
* The test accuracy for 512 and 256 neurons is significantly lower in the 64 neuron tile configuration compared to the 16 neuron tile configuration.
* The error bars tend to be larger for lower numbers of neurons, especially in the 64 neuron tile configuration.
### Interpretation
The data suggests that increasing the number of neuron tiles from 16 to 64 negatively impacts the test accuracy when using fewer total recurrent neurons (512 and 256). This could indicate that a higher number of neuron tiles requires a larger number of total recurrent neurons to maintain optimal performance. The larger error bars for lower neuron counts, especially with 64 tiles, suggest that the performance becomes less stable and more variable under these conditions. The similar performance at 2048 and 1024 neurons regardless of the number of tiles suggests that the network is less sensitive to the number of tiles when a sufficient number of neurons are available.