## Bar Charts: SHD Test Accuracy vs. Total Recurrent Neurons
### Overview
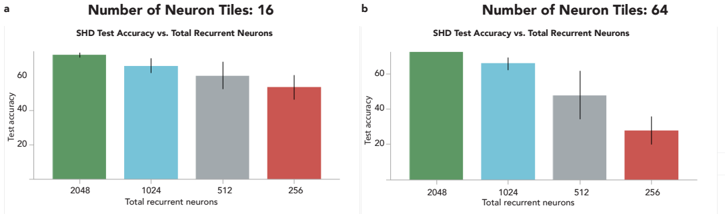
The image contains two bar charts (labeled **a** and **b**) comparing SHD test accuracy against total recurrent neurons for two different neuron tile configurations: **16** (chart **a**) and **64** (chart **b**). Each chart shows four bars representing different total recurrent neuron counts (2048, 1024, 512, 256), with test accuracy values on the y-axis.
### Components/Axes
- **X-axis**: "Total recurrent neurons" with categories: 2048, 1024, 512, 256.
- **Y-axis**: "Test accuracy" with a scale from 0 to 80.
- **Legend**: Located on the right side of each chart, with four colors:
- **Green**: 2048 total recurrent neurons
- **Blue**: 1024 total recurrent neurons
- **Gray**: 512 total recurrent neurons
- **Red**: 256 total recurrent neurons
- **Chart Titles**:
- **a**: "Number of Neuron Tiles: 16"
- **b**: "Number of Neuron Tiles: 64"
### Detailed Analysis
#### Chart **a** (Neuron Tiles: 16)
- **Green (2048 neurons)**: ~70% test accuracy.
- **Blue (1024 neurons)**: ~65% test accuracy.
- **Gray (512 neurons)**: ~60% test accuracy.
- **Red (256 neurons)**: ~50% test accuracy.
#### Chart **b** (Neuron Tiles: 64)
- **Green (2048 neurons)**: ~75% test accuracy.
- **Blue (1024 neurons)**: ~65% test accuracy.
- **Gray (512 neurons)**: ~50% test accuracy.
- **Red (256 neurons)**: ~30% test accuracy.
### Key Observations
1. **Decreasing Accuracy with Fewer Neurons**: In both charts, test accuracy declines as the total recurrent neuron count decreases.
2. **Steeper Drop in Chart **b** (64 Neuron Tiles)**: The reduction in accuracy is more pronounced when neuron tiles increase from 16 to 64. For example:
- At 256 neurons, accuracy drops from ~50% (chart **a**) to ~30% (chart **b**).
3. **Consistent Trend**: The relationship between neuron count and accuracy is linear in both charts, but the magnitude of the drop varies with neuron tile count.
### Interpretation
The data suggests that **increasing the number of neuron tiles** (from 16 to 64) amplifies the sensitivity of SHD test accuracy to reductions in total recurrent neurons. This implies a potential trade-off: models with more neuron tiles may require more recurrent neurons to maintain performance, or the architecture of larger neuron tile configurations is less robust to resource constraints. The steeper decline in chart **b** highlights that neuron tile count could be a critical factor in optimizing neural network efficiency under limited computational resources.