# Technical Document Extraction: Line Chart Analysis
## Title
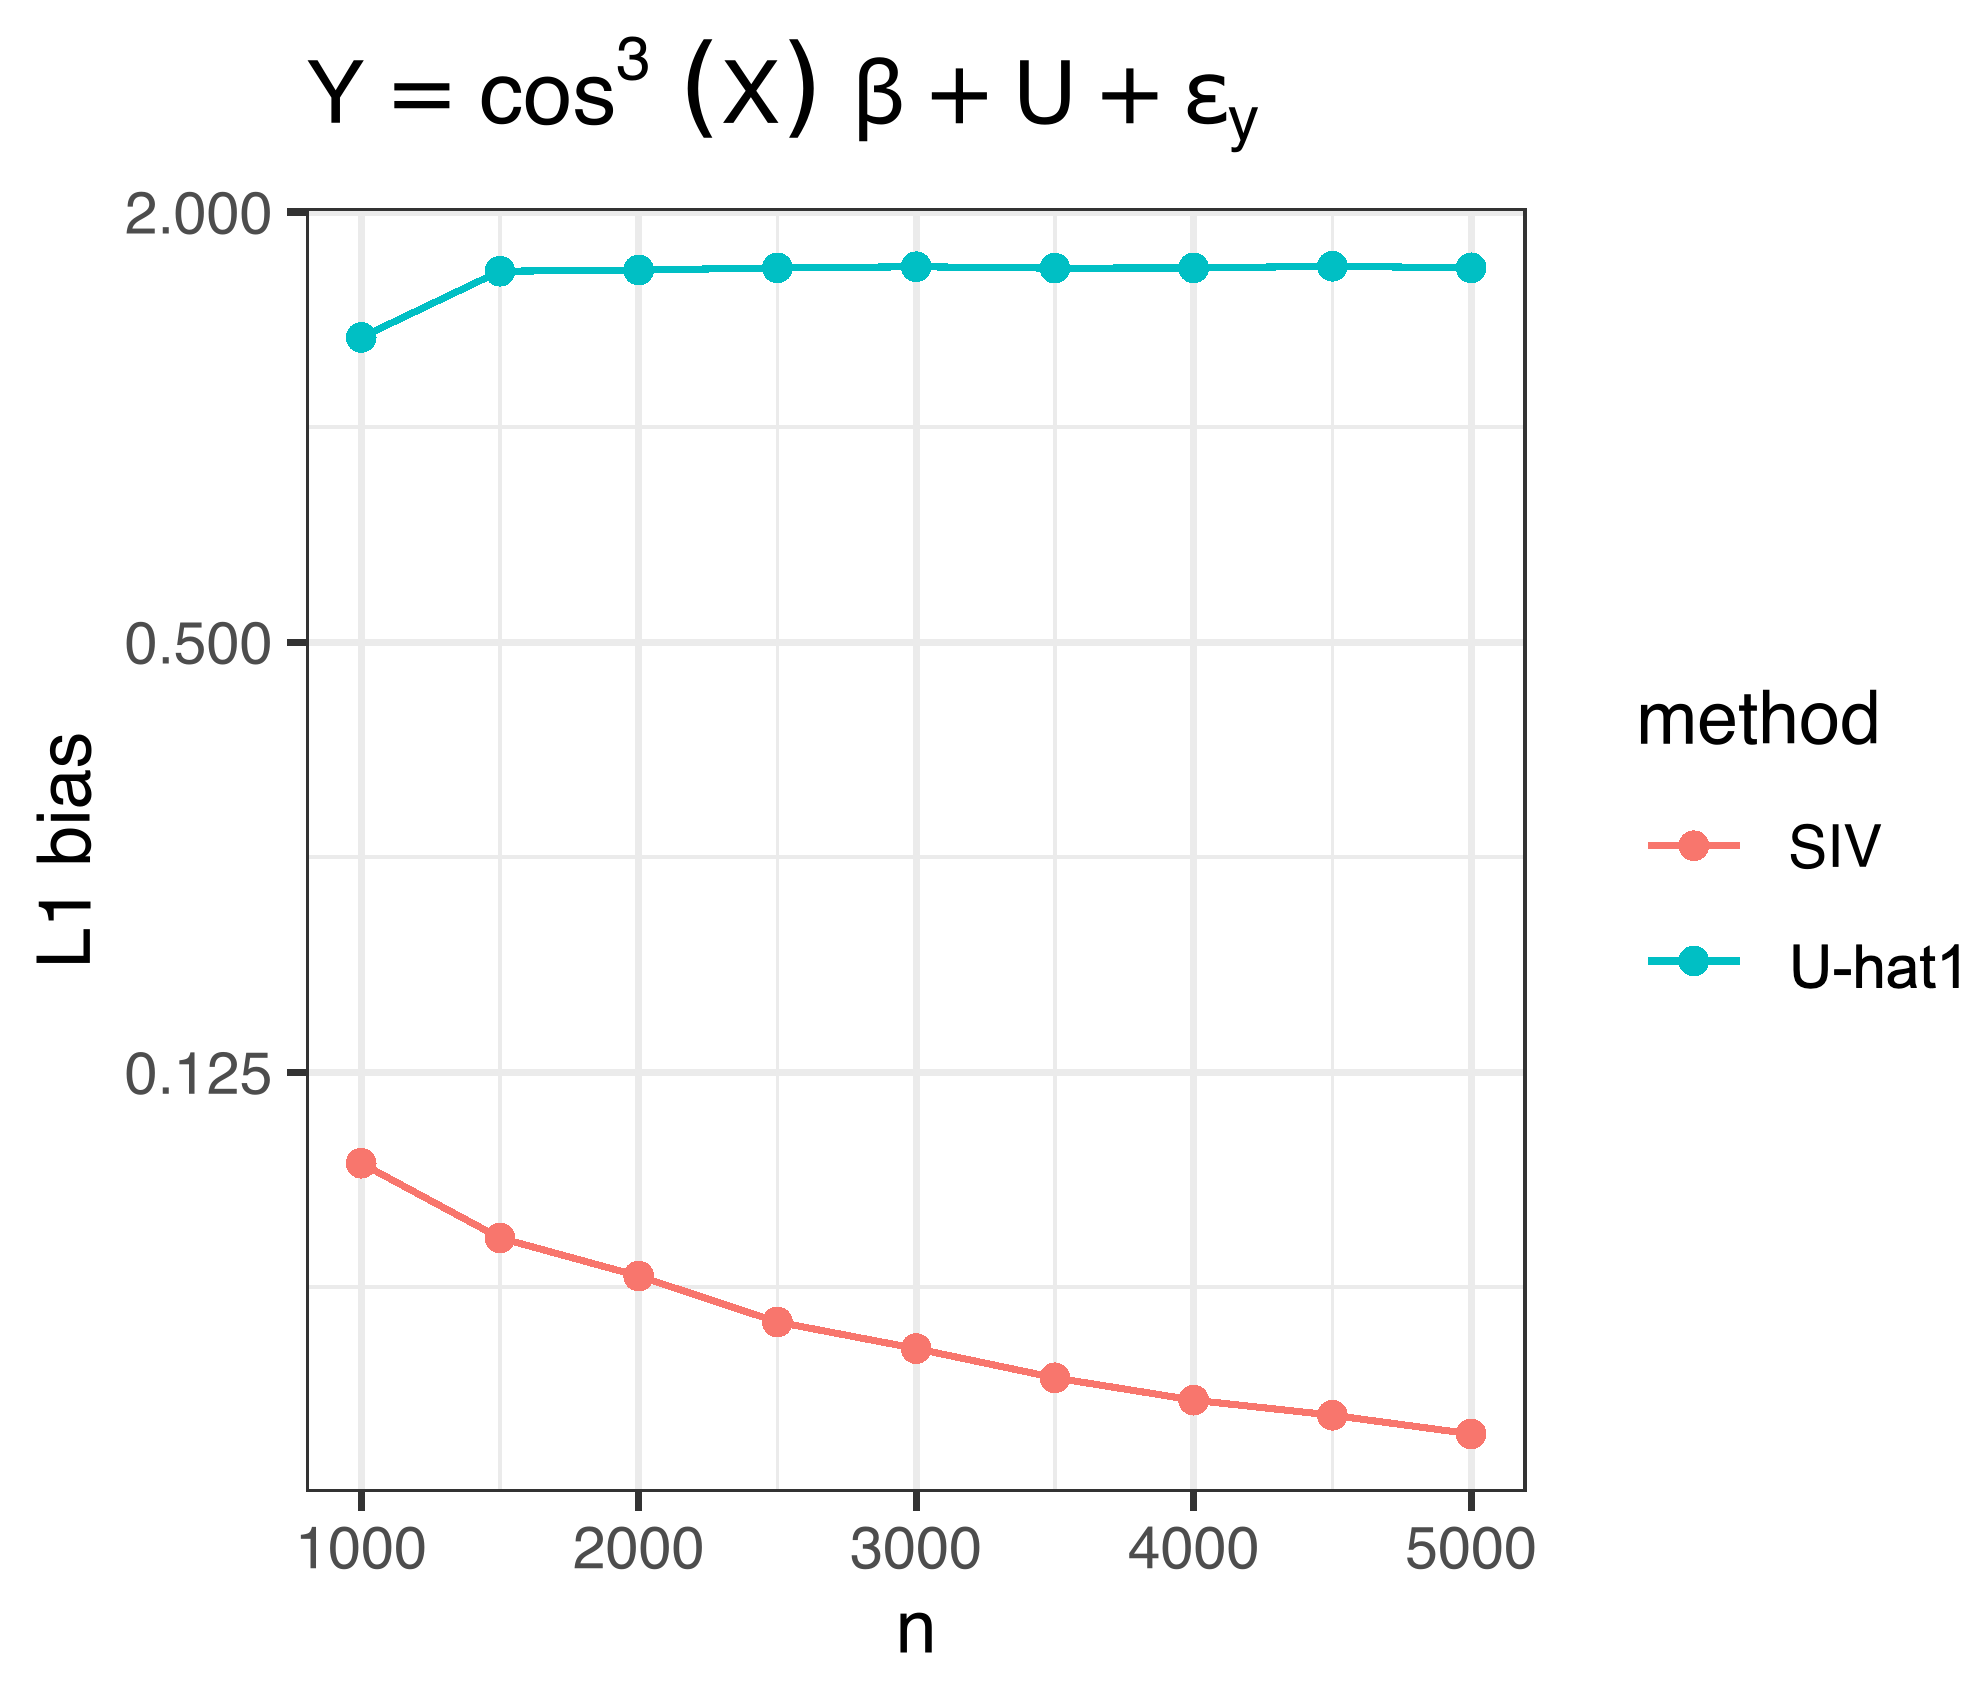
**Y = cos³(X)β + U + ε_y**
## Axes
- **X-axis**: Labeled "n" with markers at 1000, 2000, 3000, 4000, 5000.
- **Y-axis**: Labeled "L1 bias" with markers at 0, 0.125, 0.5, 1, 1.5, 2.000.
## Legend
- **Location**: Right side of the chart.
- **Entries**:
- **Red**: SIV (Solid line with circular markers).
- **Blue**: U-hat1 (Dashed line with circular markers).
## Data Series
### SIV (Red)
- **Trend**: Monotonically decreasing curve.
- **Key Data Points**:
- At **n = 1000**: ~0.125.
- At **n = 2000**: ~0.075.
- At **n = 3000**: ~0.05.
- At **n = 4000**: ~0.03.
- At **n = 5000**: ~0.025.
### U-hat1 (Blue)
- **Trend**: Flat line with minimal fluctuation.
- **Key Data Points**:
- At **n = 1000**: ~1.8.
- At **n = 2000**: ~1.9.
- At **n = 3000**: ~1.9.
- At **n = 4000**: ~1.9.
- At **n = 5000**: ~1.9.
## Observations
1. **SIV** demonstrates a clear downward trend as **n** increases, suggesting diminishing L1 bias with larger sample sizes.
2. **U-hat1** remains nearly constant across all **n** values, indicating stable L1 bias regardless of sample size.
3. The y-axis scale (0–2000) appears inconsistent with the data range (0.025–1.9), suggesting potential scaling or labeling errors.
## Spatial Grounding
- Legend is positioned on the **right** of the chart, outside the plotting area.
- Data points for **SIV** (red) and **U-hat1** (blue) are visually distinct and match legend colors exactly.
## Conclusion
The chart compares two methods (SIV and U-hat1) for estimating L1 bias under the model **Y = cos³(X)β + U + ε_y**. SIV shows improvement with increasing **n**, while U-hat1 remains invariant.