## Diagram: Causal Diagram of a Sub-Model
### Overview
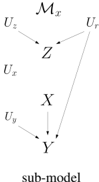
The image presents a causal diagram representing a sub-model. It illustrates the relationships between variables X, Y, and Z, along with their respective unobserved confounders U_x, U_y, U_z, and U_r. The diagram shows the causal pathways and dependencies between these variables.
### Components/Axes
* **Variables:** X, Y, Z, U_x, U_y, U_z, U_r, M_x
* **Arrows:** Represent causal relationships.
* **Text:** "sub-model" at the bottom.
### Detailed Analysis
* **M_x:** Located at the top of the diagram.
* **U_z:** Located at the top-left, with an arrow pointing to Z.
* **U_r:** Located at the top-right, with an arrow pointing to Z and Y.
* **Z:** Located in the upper-middle, with an arrow pointing to X.
* **U_x:** Located to the left of X.
* **X:** Located in the middle, with an arrow pointing to Y.
* **U_y:** Located to the left of Y, with an arrow pointing to Y.
* **Y:** Located at the bottom, representing the outcome variable.
* **Arrows:**
* U_z -> Z
* U_r -> Z
* U_r -> Y
* Z -> X
* U_x -> X
* X -> Y
* U_y -> Y
### Key Observations
* Z is a mediator between U_z, U_r and X.
* X is a mediator between Z, U_x and Y.
* Y is influenced by X, U_y, and U_r.
* U_r is a confounder affecting both Z and Y.
### Interpretation
The diagram represents a causal model where X influences Y, and Z influences X. The variables U_x, U_y, U_z, and U_r represent unobserved confounders that may affect the relationships between the observed variables. The presence of U_r influencing both Z and Y indicates a potential confounding effect that needs to be addressed when analyzing the causal relationship between Z and Y. The "sub-model" label suggests that this diagram is a part of a larger causal model.