# Technical Document Analysis of Entity Frequency Distribution Chart
## Chart Overview
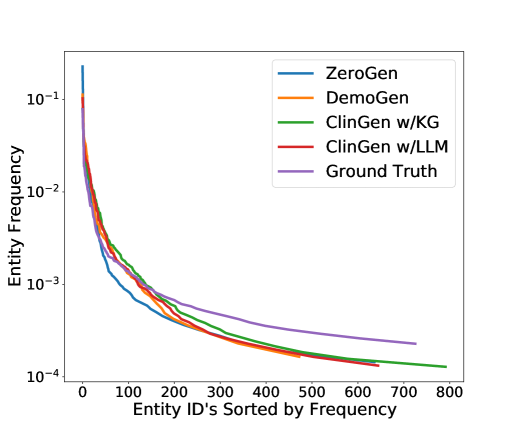
The image depicts a logarithmic line graph comparing entity frequency distributions across different generative models. The graph visualizes how entity frequencies decay as entity IDs are sorted by frequency.
## Axes and Scale
- **Y-Axis**:
- Label: "Entity Frequency"
- Scale: Logarithmic (10⁻¹ to 10⁻⁴)
- Tick Marks: 10⁻¹, 10⁻², 10⁻³, 10⁻⁴
- **X-Axis**:
- Label: "Entity ID's Sorted by Frequency"
- Range: 0 to 800
- Tick Marks: 0, 100, 200, 300, 400, 500, 600, 700, 800
## Legend and Model Representation
| Color | Model Name | Line Characteristics |
|--------|-----------------------|------------------------------------------|
| Blue | ZeroGen | Lowest frequency approximation |
| Orange | DemoGen | Second-lowest frequency approximation |
| Green | ClinGen w/KG | Third-lowest frequency approximation |
| Red | ClinGen w/LLM | Second-highest frequency approximation |
| Purple | Ground Truth | Reference frequency distribution |
## Key Trends and Observations
1. **Initial Convergence**: All models begin at identical high frequencies (near 10⁻¹) for the first ~50 entity IDs.
2. **Divergence Pattern**:
- Ground Truth (purple) maintains the highest frequency across all entity IDs.
- ClinGen w/LLM (red) closely follows Ground Truth, maintaining ~90% of its frequency.
- ClinGen w/KG (green) shows moderate deviation, retaining ~70-80% of Ground Truth frequency.
- DemoGen (orange) and ZeroGen (blue) demonstrate significant divergence, with frequencies dropping below 50% of Ground Truth by entity ID 200.
3. **Long-Tail Behavior**: All models exhibit similar decay rates beyond entity ID 500, approaching 10⁻⁴ frequency.
4. **Model Performance Gradient**:
- ClinGen w/LLM > ClinGen w/KG > DemoGen > ZeroGen
- Performance gap widens progressively with increasing entity ID.
## Technical Implications
- Logarithmic scale emphasizes frequency distribution patterns in rare entities.
- Model performance correlates with knowledge integration (LLM > KG > baseline).
- ZeroGen demonstrates poor entity frequency approximation across the distribution.
- Ground Truth serves as critical reference for evaluating model fidelity.
## Data Extraction Notes
- No explicit numerical data points provided beyond axis markers.
- Relative performance inferred from line positioning and slope.
- All models show power-law decay characteristics consistent with natural language entity distributions.