## Diagram Collection: Hierarchical Network Structures with Minimal Configurations
### Overview
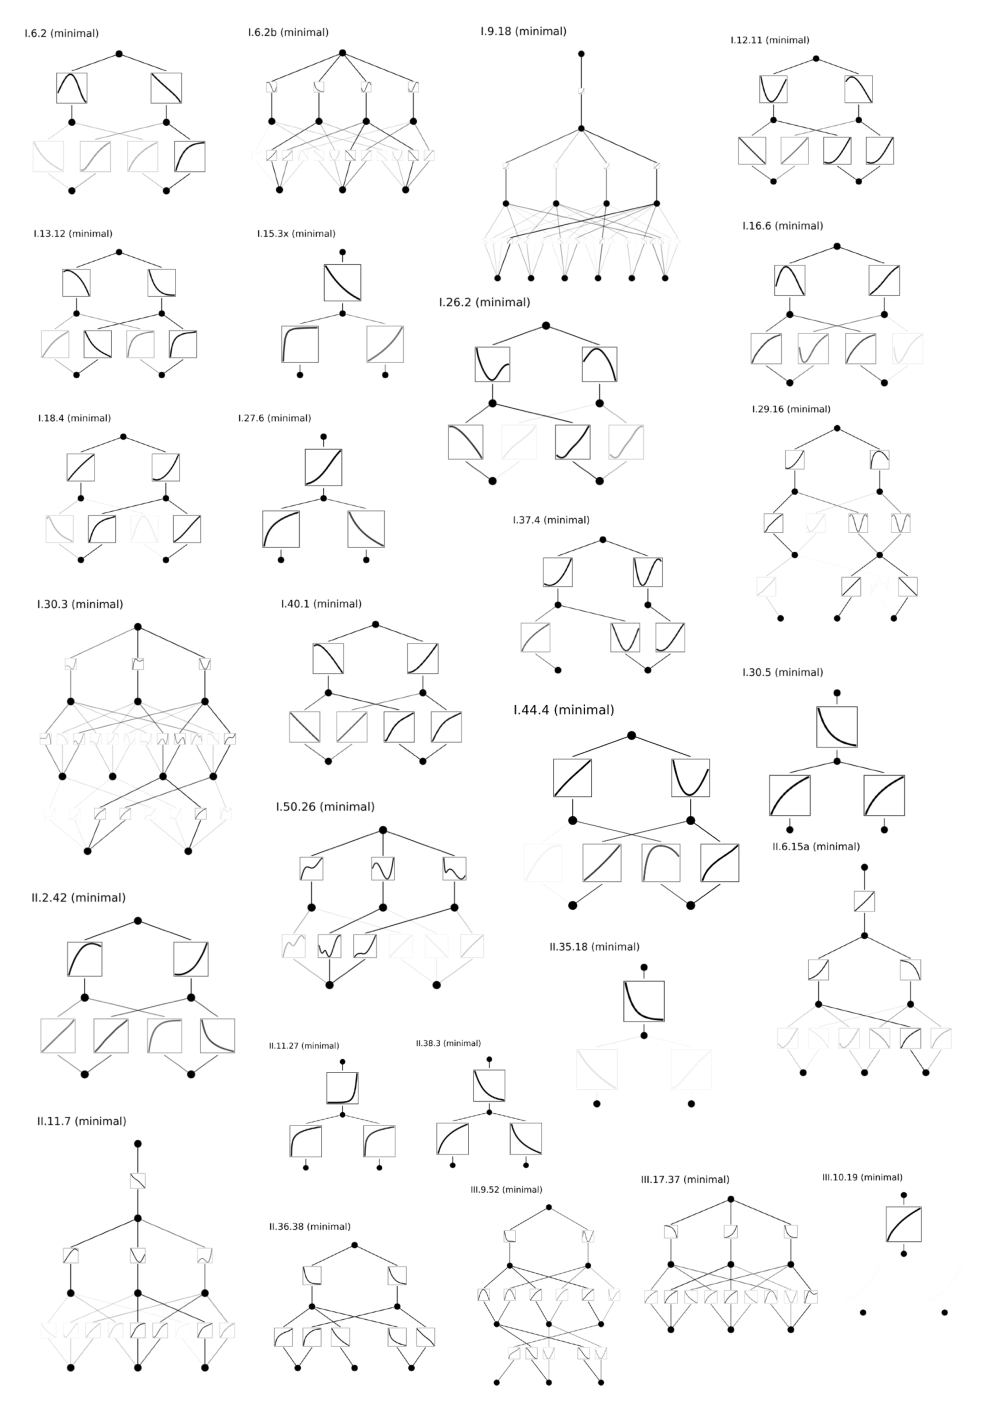
The image contains 25 distinct diagrams labeled with identifiers (e.g., "I.6.2 (minimal)", "II.2.42 (minimal)") and structured as hierarchical networks. Each diagram features nodes (circles/squares) connected by edges (lines), with some nodes containing internal subgraphs (smaller diagrams within squares). The "minimal" label suggests these represent simplified or foundational configurations.
### Components/Axes
- **Nodes**:
- Represented as circles (primary nodes) and squares (subgraphs).
- Subgraphs contain internal diagrams resembling smaller versions of the main structure.
- **Edges**:
- Lines connecting nodes, some with arrows indicating directionality.
- No explicit labels for edges, but thickness varies slightly.
- **Labels**:
- Each diagram has a unique identifier (e.g., "I.6.2 (minimal)") positioned at the top-left.
- No axis titles, legends, or numerical scales present.
### Detailed Analysis
1. **Structure Patterns**:
- Most diagrams follow a tree-like hierarchy with a root node at the top and branching subgraphs.
- Subgraphs often mirror the parent structure but with reduced complexity (e.g., fewer nodes or layers).
- Example: "I.6.2 (minimal)" shows a root node splitting into two subgraphs, each with three nodes.
2. **Variability**:
- Diagrams vary in depth (number of layers) and breadth (nodes per layer).
- Some (e.g., "I.9.18 (minimal)") have dense interconnections between subgraphs, while others (e.g., "II.11.7 (minimal)") are linear.
3. **Embedded Text**:
- No additional text within diagrams beyond the identifiers.
### Key Observations
- **Recursive Design**: Subgraphs within squares replicate the parent diagram’s structure, suggesting a fractal or self-similar pattern.
- **Minimalism**: All diagrams are labeled "minimal," implying they represent base cases or irreducible configurations.
- **Directionality**: Arrows in some diagrams (e.g., "I.26.2 (minimal)") indicate workflow or dependency relationships.
### Interpretation
These diagrams likely represent **minimal network topologies** or **decision trees** in a technical context (e.g., computer science, operations research). The recursive subgraphs suggest modularity, where complex systems are decomposed into simpler, repeatable units. The absence of numerical data implies the focus is on structural relationships rather than quantitative metrics.
- **Technical Implications**:
- The "minimal" label may indicate foundational models for scaling or optimization.
- Directional edges could represent data flow, control paths, or dependency chains.
- **Anomalies**:
- Diagram "I.40.1 (minimal)" has an unusually dense subgraph, deviating from the typical sparse minimal structure.
- Some diagrams (e.g., "II.38.3 (minimal)") lack subgraphs entirely, raising questions about their classification as "minimal."
This collection appears to document variations of a core structural principle, prioritizing simplicity and modularity in hierarchical systems.