## Chart: Average nDCG@10 vs. Training Steps for S2ORC and Full Data
### Overview
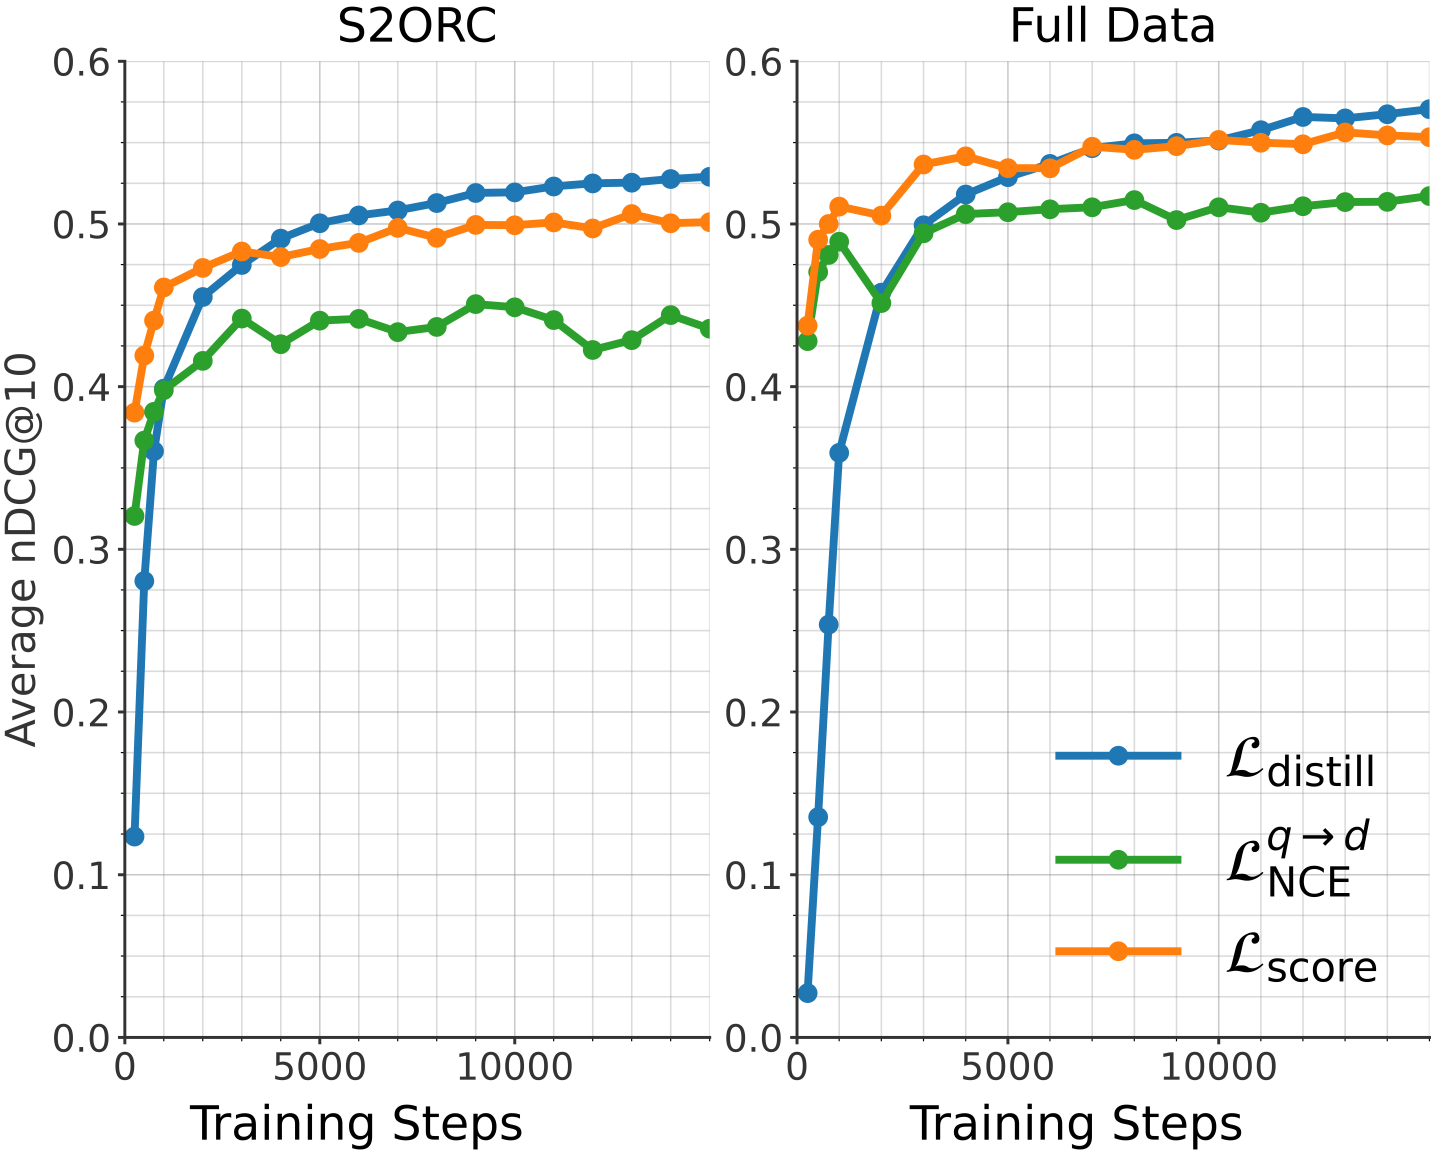
The image presents two line charts comparing the performance of three different loss functions (L_distill, L_NCE^(q->d), and L_score) during training. The left chart shows results for the S2ORC dataset, while the right chart shows results for the Full Data dataset. The y-axis represents the average nDCG@10 (Normalized Discounted Cumulative Gain at 10), and the x-axis represents the training steps.
### Components/Axes
* **Titles:**
* Left Chart: S2ORC
* Right Chart: Full Data
* **X-axis:** Training Steps
* Scale: 0 to 10000, with tick marks at 0, 5000, and 10000.
* **Y-axis:** Average nDCG@10
* Scale: 0.0 to 0.6, with tick marks at intervals of 0.1.
* **Legend:** Located in the bottom-right corner of the right chart.
* Blue line: L_distill
* Green line: L_NCE^(q->d)
* Orange line: L_score
### Detailed Analysis
**Left Chart (S2ORC):**
* **L_distill (Blue):** Starts at approximately 0.12, rises sharply to about 0.45 by 1000 training steps, and then gradually increases to approximately 0.53 by 10000 training steps.
* **L_NCE^(q->d) (Green):** Starts at approximately 0.32, rises to about 0.44 by 1000 training steps, fluctuates between 0.42 and 0.45 until 10000 training steps.
* **L_score (Orange):** Starts at approximately 0.39, rises to about 0.48 by 1000 training steps, and then gradually increases to approximately 0.50 by 10000 training steps.
**Right Chart (Full Data):**
* **L_distill (Blue):** Starts at approximately 0.03, rises sharply to about 0.50 by 2000 training steps, and then gradually increases to approximately 0.56 by 10000 training steps.
* **L_NCE^(q->d) (Green):** Starts at approximately 0.42, rises to about 0.52 by 2000 training steps, and then fluctuates around 0.52 to 0.55 until 10000 training steps.
* **L_score (Orange):** Starts at approximately 0.40, rises to about 0.51 by 1000 training steps, and then fluctuates around 0.54 to 0.56 until 10000 training steps.
### Key Observations
* In both charts, L_distill shows the most significant initial improvement with training steps.
* For the S2ORC dataset, L_distill achieves the highest nDCG@10, while for the Full Data dataset, L_distill, L_NCE^(q->d), and L_score achieve similar nDCG@10 values after 10000 training steps.
* L_NCE^(q->d) shows more fluctuation compared to the other two loss functions, especially in the S2ORC dataset.
### Interpretation
The charts demonstrate the performance of different loss functions in training a model for ranking tasks, as measured by the average nDCG@10. The results suggest that L_distill is effective in quickly improving the ranking performance, especially when trained on the S2ORC dataset. The Full Data dataset shows that all three loss functions converge to similar performance levels after sufficient training. The fluctuations observed in L_NCE^(q->d) might indicate instability or sensitivity to the training data. The choice of loss function may depend on the specific dataset and the desired trade-off between initial improvement and final performance.