## Line Chart: Training Performance Comparison
### Overview
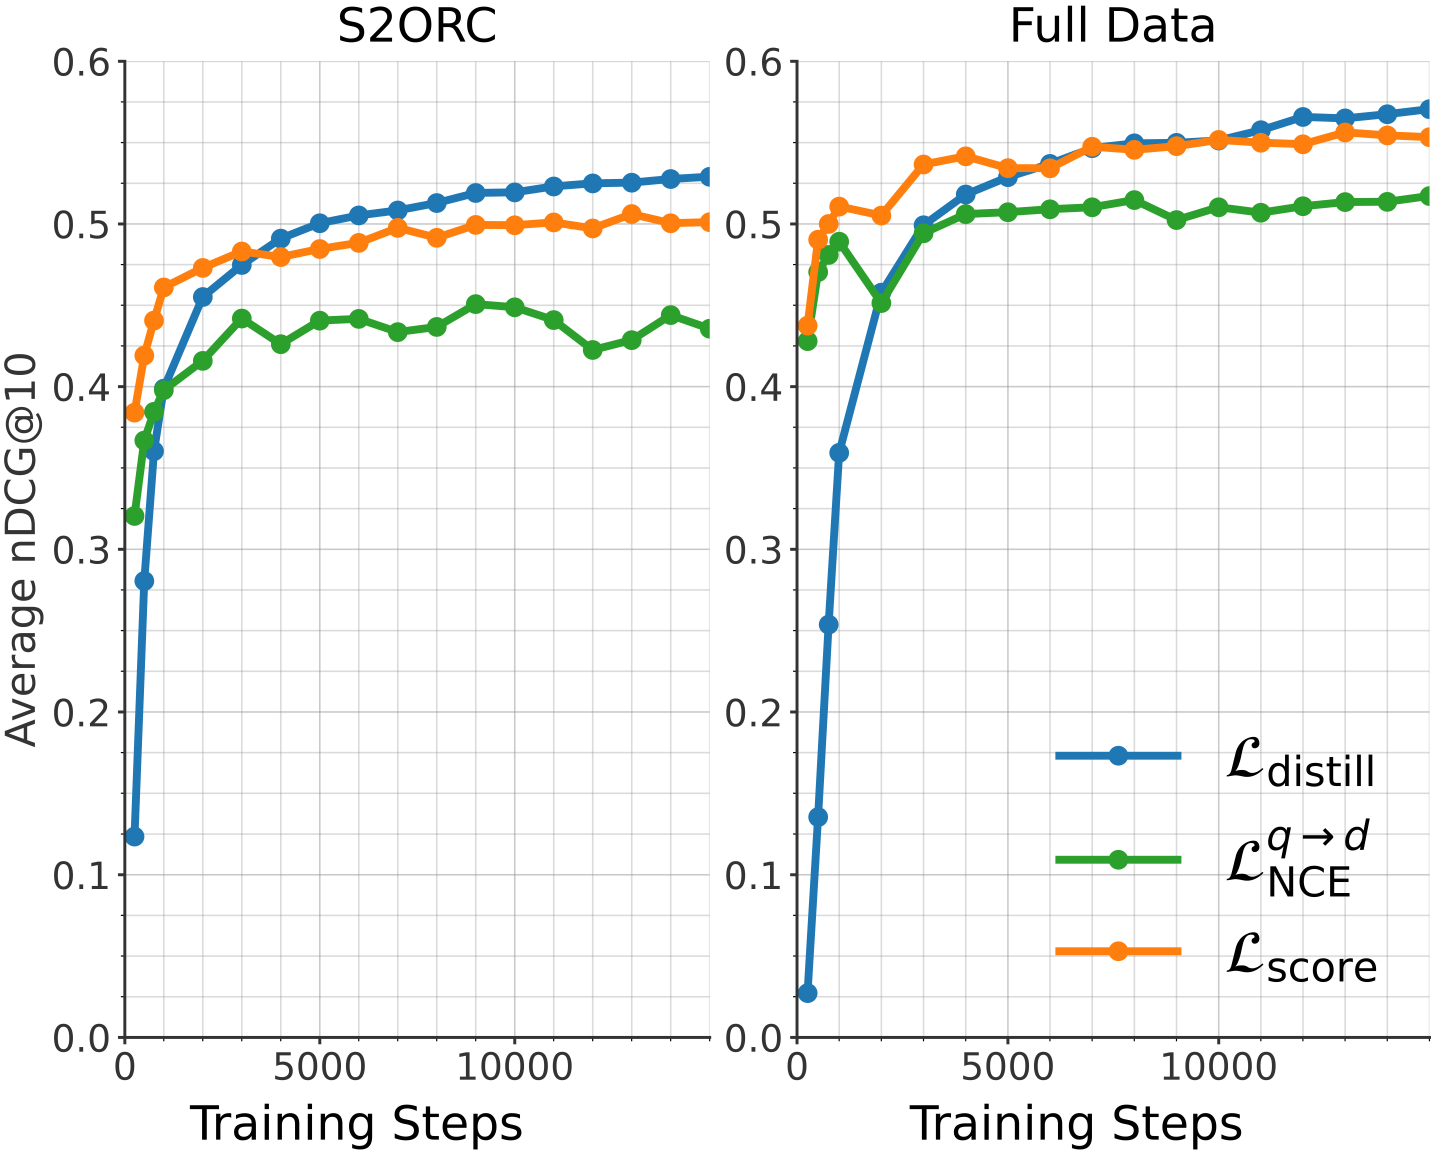
The image presents two line charts comparing the training performance of different loss functions on two datasets: S2ORC and Full Data. The performance metric is Average nDCG@10, plotted against Training Steps. Each chart displays three loss functions: $\mathcal{L}_{distill}$, $\mathcal{L}^{q \rightarrow d}_{NCE}$, and $\mathcal{L}_{score}$.
### Components/Axes
* **X-axis:** Training Steps (ranging from 0 to approximately 10,000)
* **Y-axis:** Average nDCG@10 (ranging from 0.0 to 0.6)
* **Left Chart Title:** S2ORC
* **Right Chart Title:** Full Data
* **Legend:** Located on the bottom-right of the image.
* Blue Line: $\mathcal{L}_{distill}$ (Distillation Loss)
* Green Line: $\mathcal{L}^{q \rightarrow d}_{NCE}$ (NCE Loss)
* Orange Line: $\mathcal{L}_{score}$ (Score Loss)
### Detailed Analysis or Content Details
**S2ORC Chart (Left):**
* **$\mathcal{L}_{distill}$ (Blue Line):** Starts at approximately 0.42, increases rapidly to around 0.54 by 2000 training steps, then plateaus around 0.55-0.57 for the remainder of the training.
* **$\mathcal{L}^{q \rightarrow d}_{NCE}$ (Green Line):** Begins at approximately 0.41, increases to around 0.48 by 2000 training steps, then fluctuates between 0.45 and 0.49, showing a slight downward trend after 8000 steps.
* **$\mathcal{L}_{score}$ (Orange Line):** Starts at approximately 0.45, increases to around 0.52 by 2000 training steps, then plateaus around 0.52-0.54 for the remainder of the training.
**Full Data Chart (Right):**
* **$\mathcal{L}_{distill}$ (Blue Line):** Starts at approximately 0.38, increases rapidly to around 0.56 by 2000 training steps, then plateaus around 0.57-0.60 for the remainder of the training.
* **$\mathcal{L}^{q \rightarrow d}_{NCE}$ (Green Line):** Begins at approximately 0.40, increases to around 0.50 by 2000 training steps, then fluctuates between 0.50 and 0.54, showing a slight upward trend after 8000 steps.
* **$\mathcal{L}_{score}$ (Orange Line):** Starts at approximately 0.42, increases to around 0.53 by 2000 training steps, then plateaus around 0.53-0.56 for the remainder of the training.
### Key Observations
* In both datasets, $\mathcal{L}_{distill}$ consistently achieves the highest Average nDCG@10, indicating superior performance compared to the other loss functions.
* The performance gap between the loss functions appears to be more pronounced in the "Full Data" chart than in the "S2ORC" chart.
* All loss functions exhibit diminishing returns after approximately 2000 training steps, suggesting that further training may not yield significant improvements.
* $\mathcal{L}^{q \rightarrow d}_{NCE}$ shows more fluctuation in performance compared to the other two loss functions, particularly in the S2ORC dataset.
### Interpretation
The charts demonstrate the effectiveness of the distillation loss ($\mathcal{L}_{distill}$) in improving the ranking performance of the model on both the S2ORC and Full Data datasets. The higher nDCG@10 values achieved by $\mathcal{L}_{distill}$ suggest that it is better at learning to rank relevant documents higher than irrelevant ones.
The difference in performance between the two datasets could be attributed to the size and diversity of the data. The "Full Data" dataset likely contains more examples and a wider range of document types, which allows the model to learn more robust ranking functions.
The plateauing of performance after 2000 training steps suggests that the model is approaching its capacity on these datasets. Further improvements may require more complex model architectures, larger datasets, or different training strategies. The fluctuations observed in $\mathcal{L}^{q \rightarrow d}_{NCE}$ could indicate instability during training, potentially due to the specific properties of the NCE loss function or the dataset.