## Line Graphs: Average nDCG@10 vs Training Steps (S2ORC and Full Data)
### Overview
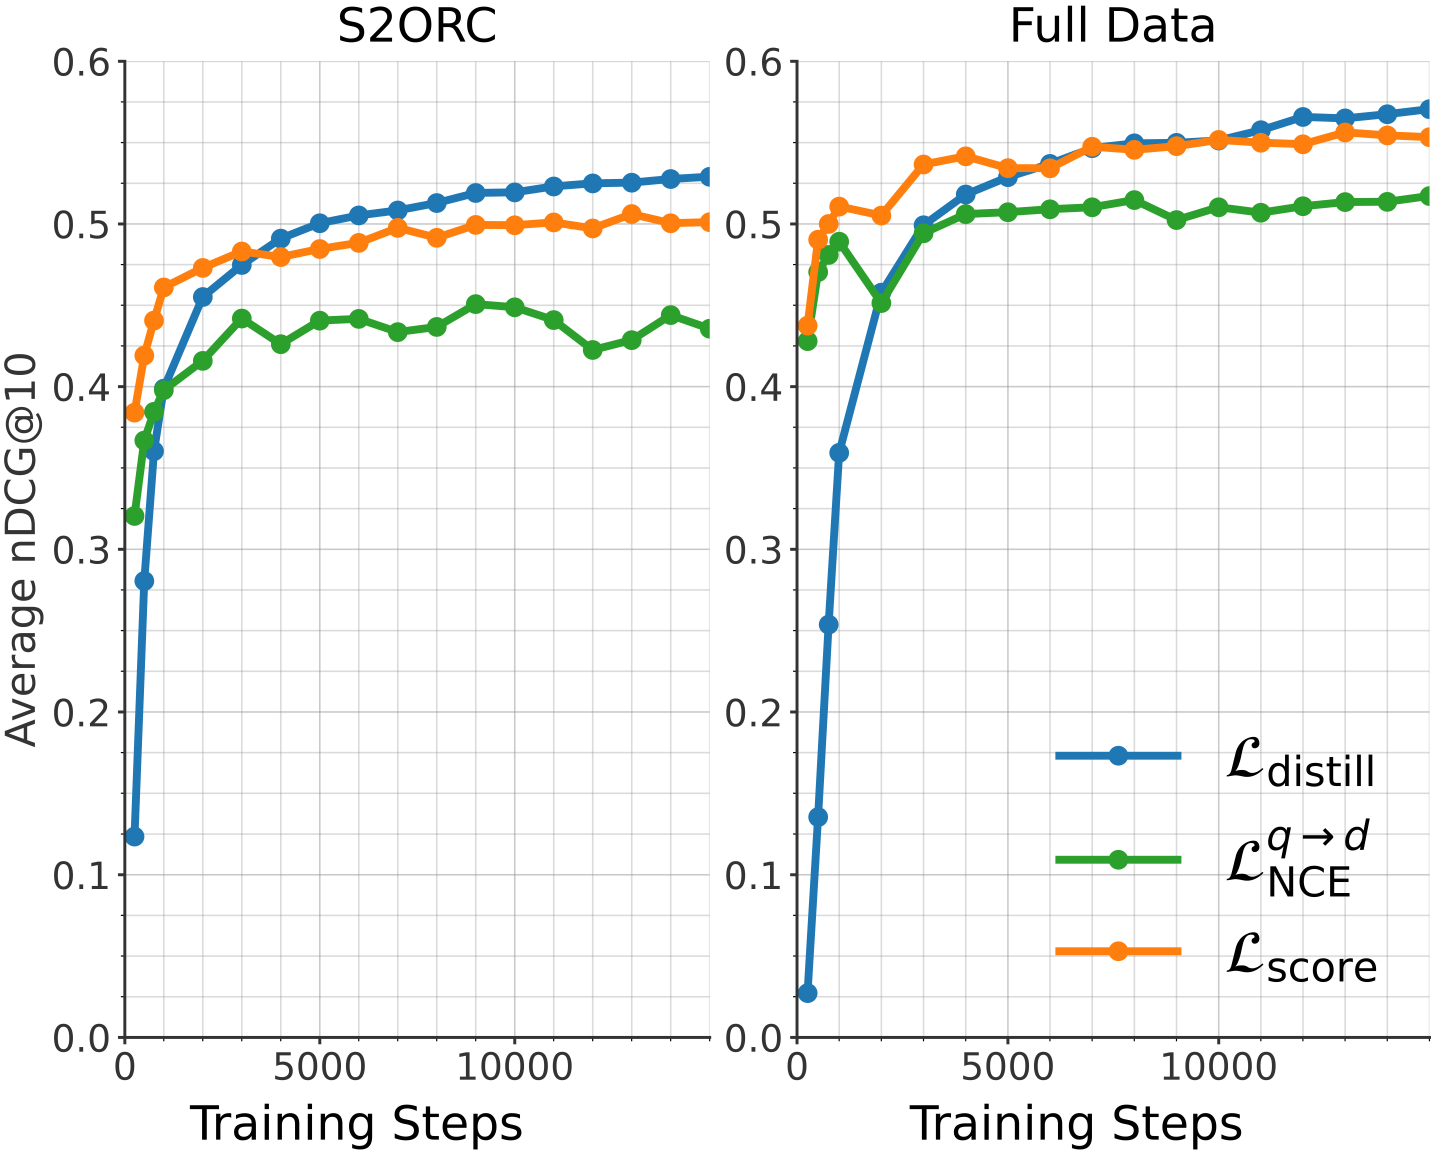
The image contains two side-by-side line graphs comparing the performance of three loss functions (`L_distill`, `L_NCE`, `L_score`) over training steps. The y-axis measures "Average nDCG@10" (normalized Discounted Cumulative Gain at 10 results), and the x-axis represents "Training Steps" (0 to 15,000). The graphs are labeled "S2ORC" (left) and "Full Data" (right), indicating different datasets or experimental conditions.
---
### Components/Axes
- **X-axis**: Training Steps (0 to 15,000, linear scale).
- **Y-axis**: Average nDCG@10 (0.0 to 0.6, linear scale).
- **Legends**:
- Blue line: `L_distill` (distillation loss).
- Green line: `L_NCE` (contrastive loss).
- Orange line: `L_score` (retrieval score loss).
- **Placement**: Legends are positioned on the right side of each plot.
---
### Detailed Analysis
#### S2ORC Plot
1. **L_distill (Blue)**:
- Starts at ~0.12 at 0 steps, rises sharply to ~0.52 by 5,000 steps, then plateaus with minor fluctuations (~0.52–0.54).
- Shows the steepest initial improvement.
2. **L_NCE (Green)**:
- Begins at ~0.32, increases gradually to ~0.44 by 5,000 steps, then stabilizes (~0.42–0.45).
- Exhibits minor oscillations (e.g., ~0.43 at 10,000 steps).
3. **L_score (Orange)**:
- Starts at ~0.40, rises to ~0.49 by 5,000 steps, then plateaus (~0.49–0.51).
- Remains intermediate between the other two lines.
#### Full Data Plot
1. **L_distill (Blue)**:
- Starts at ~0.03, surges to ~0.54 by 5,000 steps, then plateaus (~0.54–0.57).
- Outperforms other lines after ~2,000 steps.
2. **L_NCE (Green)**:
- Begins at ~0.42, rises to ~0.51 by 5,000 steps, then stabilizes (~0.50–0.52).
- Shows less volatility than in S2ORC.
3. **L_score (Orange)**:
- Starts at ~0.44, increases to ~0.55 by 5,000 steps, then plateaus (~0.55–0.57).
- Converges with `L_distill` by 15,000 steps.
---
### Key Observations
1. **S2ORC**:
- `L_distill` outperforms `L_NCE` and `L_score` after ~2,000 steps.
- `L_NCE` shows the most variability (e.g., dips to ~0.41 at 8,000 steps).
2. **Full Data**:
- `L_distill` achieves the highest nDCG@10 (~0.57) by 15,000 steps.
- `L_score` and `L_NCE` converge closely (~0.55–0.57) in later stages.
3. **General Trends**:
- All loss functions improve performance with training steps.
- `L_distill` demonstrates the fastest and most consistent gains in both datasets.
---
### Interpretation
The data suggests that **distillation loss (`L_distill`)** is the most effective for improving retrieval performance (nDCG@10) across both S2ORC and Full Data. In the Full Data scenario, `L_distill` achieves superior results, indicating its scalability. The convergence of `L_score` and `L_NCE` in later training steps implies diminishing returns for these losses with increased data complexity. The sharp initial rise of `L_distill` highlights its efficiency in leveraging training data for rapid performance gains. These trends align with prior work on distillation techniques in retrieval systems, where knowledge transfer from large models improves downstream task performance.