## Waveform Analysis: Wilkinson Becky Hill - Afterglow
### Overview
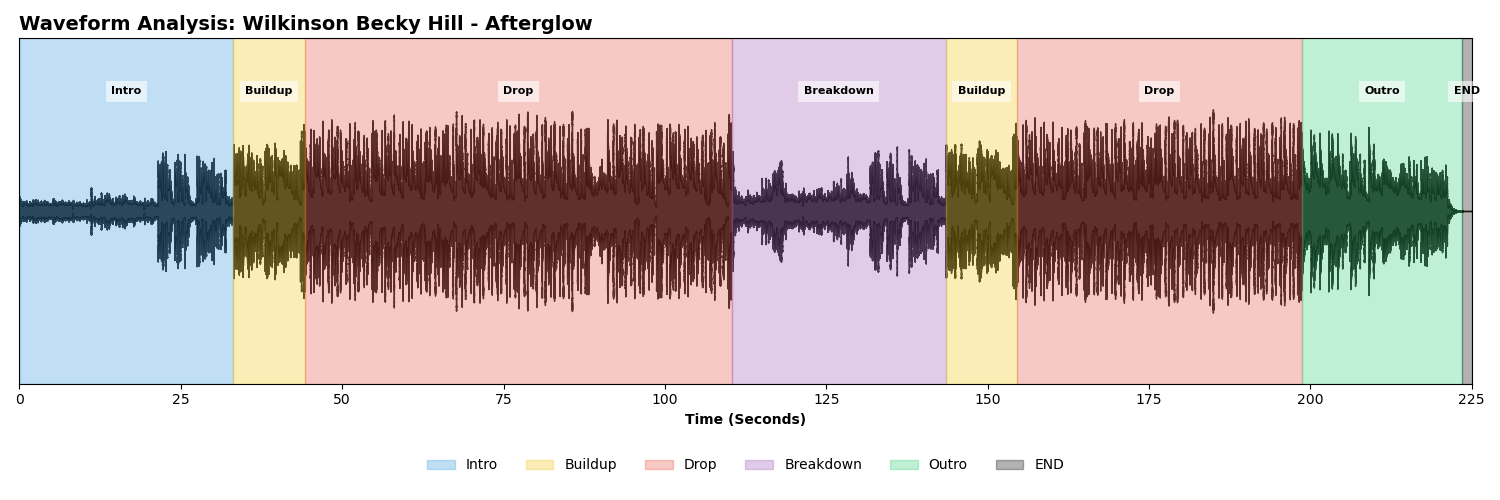
The image is a time-series visualization of the audio waveform for the song "Afterglow" by Wilkinson and Becky Hill. The chart maps the audio amplitude (vertical axis) against time in seconds (horizontal axis). The background is color-coded to segment the song into distinct structural phases, providing a visual representation of the track's arrangement and energy levels.
### Components/Axes
* **Header:** "Waveform Analysis: Wilkinson Becky Hill - Afterglow"
* **X-Axis (Time):** Represents time in seconds, ranging from 0 to 225. Markers are provided at 25-second intervals (0, 25, 50, 75, 100, 125, 150, 175, 200, 225).
* **Y-Axis:** Implicit amplitude (loudness). The vertical height of the waveform indicates the intensity of the audio signal.
* **Legend (Bottom):**
* **Light Blue:** Intro
* **Yellow:** Buildup
* **Red/Pink:** Drop
* **Purple:** Breakdown
* **Green:** Outro
* **Grey:** END
### Detailed Analysis
The chart is segmented from left to right. Below are the approximate time intervals for each section based on the visual markers:
| Section | Color | Start Time (s) | End Time (s) | Visual Characteristics |
| :--- | :--- | :--- | :--- | :--- |
| **Intro** | Light Blue | 0 | ~33 | Low amplitude, sparse waveform, gradual increase in density. |
| **Buildup** | Yellow | ~33 | ~45 | Increasing density, leading into the first drop. |
| **Drop** | Red/Pink | ~45 | ~110 | High amplitude, "brick-wall" density, consistent high energy. |
| **Breakdown** | Purple | ~110 | ~145 | Significant reduction in amplitude, sparse waveform, melodic/vocal focus. |
| **Buildup** | Yellow | ~145 | ~155 | Increasing density, leading into the second drop. |
| **Drop** | Red/Pink | ~155 | ~200 | High amplitude, high density, mirroring the first drop. |
| **Outro** | Green | ~200 | ~223 | Tapering amplitude, fading out. |
| **END** | Grey | ~223 | 225 | Silence/Final fade. |
### Key Observations
* **Structural Symmetry:** The track follows a standard electronic dance music (EDM) arrangement: Intro -> Buildup -> Drop -> Breakdown -> Buildup -> Drop -> Outro.
* **Amplitude Dynamics:** The "Drop" sections exhibit the highest amplitude and visual density, characteristic of Drum & Bass production where limiting is used to maximize perceived loudness.
* **Energy Contrast:** There is a stark visual contrast between the "Drop" sections (high density) and the "Breakdown" section (low density), indicating a significant shift in musical intensity.
* **Duration:** The total track length is approximately 225 seconds (3 minutes and 45 seconds).
### Interpretation
This visualization demonstrates the "loudness war" and structural conventions typical of modern Drum & Bass music.
* **Data Meaning:** The waveform density is a proxy for energy. The "Drop" sections are visually "maxed out," suggesting heavy compression and limiting to ensure the track sounds loud and impactful on club sound systems.
* **Structural Flow:** The chart highlights the cyclical nature of the track. The repetition of the Buildup-Drop sequence (occurring twice) is a fundamental technique to maintain listener engagement.
* **Peircean Investigative Note:** The visual "gap" or reduction in amplitude during the "Breakdown" (110s–145s) serves as a narrative reset. By reducing the visual density (and thus the sonic intensity), the producer creates a "vacuum" that makes the subsequent "Buildup" and "Drop" feel more powerful by comparison. The chart effectively maps the *emotional arc* of the song through purely technical data.