## Line Chart: Waveform Analysis of "Afterglow" by Wilkinson Becky Hill
### Overview
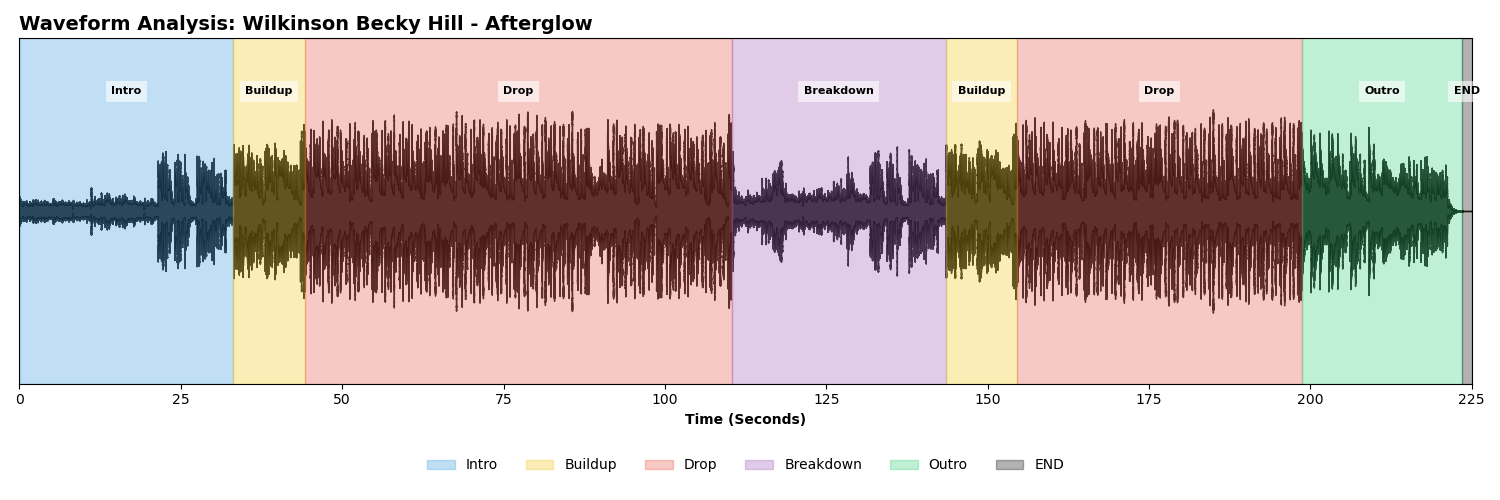
The chart displays a time-domain waveform analysis of the audio track "Afterglow" by Wilkinson Becky Hill. It visualizes amplitude variations over time, segmented into labeled sections with distinct colors. The waveform exhibits dynamic changes in intensity, reflecting the song's structural progression.
### Components/Axes
- **X-axis**: Time (Seconds), ranging from 0 to 225 seconds, divided into 10-second intervals.
- **Y-axis**: Amplitude (normalized to ±1.0), with no explicit scale but visible peaks/troughs.
- **Legend**: Located at the bottom, mapping colors to sections:
- Blue: Intro
- Yellow: Buildup
- Red: Drop
- Purple: Breakdown
- Green: Outro
- Gray: END
- **Labels**: Section names (e.g., "Intro," "Buildup") are positioned above their respective colored segments.
### Detailed Analysis
1. **Intro (0–30s, Blue)**:
- Amplitude remains low (~0.1–0.3), with minor fluctuations.
- Sudden peak at ~25s (~0.5) before returning to baseline.
2. **Buildup (30–40s, Yellow)**:
- Gradual amplitude increase from ~0.2 to ~0.6.
- Sustained oscillations with moderate intensity.
3. **Drop (40–100s, Red)**:
- Dominant high-amplitude oscillations (~0.7–0.9).
- Irregular peaks and troughs, indicating rhythmic complexity.
4. **Breakdown (100–130s, Purple)**:
- Amplitude drops to ~0.3–0.5, with reduced frequency of peaks.
- Sparse, isolated spikes suggest a quieter, fragmented section.
5. **Buildup (130–150s, Yellow)**:
- Rapid amplitude rise from ~0.4 to ~0.8.
- Sharp, repetitive peaks mirroring the initial Buildup.
6. **Drop (150–200s, Red)**:
- Similar to the first Drop, with sustained high-amplitude oscillations (~0.7–0.9).
- Increased density of peaks compared to the first Drop.
7. **Outro (200–225s, Green)**:
- Gradual amplitude decay from ~0.6 to ~0.1.
- Final sharp drop to zero at 225s, marked by the "END" label.
### Key Observations
- **Structural Symmetry**: The first and second Drops (40–100s and 150–200s) exhibit comparable amplitude ranges but differ in peak density.
- **Dynamic Contrast**: The Breakdown (100–130s) serves as a transitional "quiet" section between high-energy Drops.
- **Amplitude Extremes**: The maximum amplitude (~0.9) occurs in both Drops, while the minimum (~0.1) is in the Intro and END.
- **Temporal Precision**: The END section’s abrupt termination at 225s suggests a programmed cutoff rather than a natural fade.
### Interpretation
The waveform reveals a deliberate compositional structure:
- **Intro** establishes a baseline, building tension through the **Buildup**.
- **Drop** sections (40–100s and 150–200s) represent climactic moments, with the second Drop showing increased rhythmic complexity.
- The **Breakdown** acts as a narrative pause, contrasting with the preceding intensity.
- The **Outro**’s gradual fade and abrupt END suggest a technical conclusion, possibly indicating a loop or abrupt silence in the original audio.
The chart underscores the interplay between amplitude and time, mapping the song’s emotional arc through technical parameters. The use of color-coded segments aligns with common DAW (Digital Audio Workstation) workflows, where sections are visually distinguished for editing or analysis.