\n
## Line Chart: Success Rate vs. Problem Size for Different Difficulties
### Overview
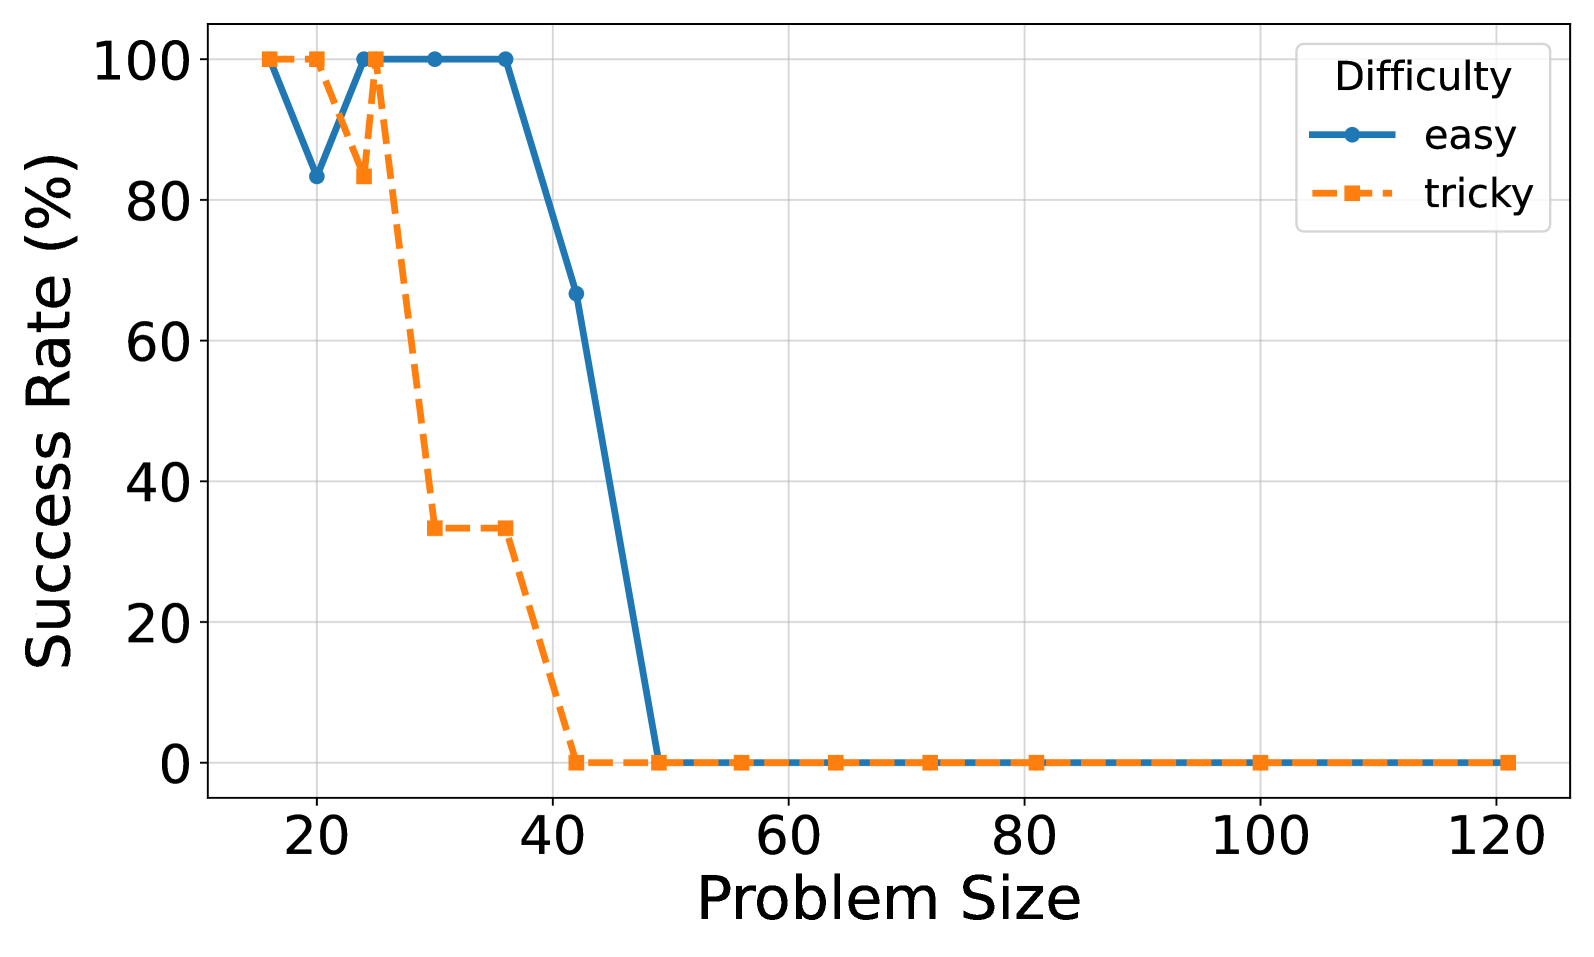
This line chart depicts the relationship between problem size and success rate for two difficulty levels: "easy" and "tricky". The x-axis represents the problem size, and the y-axis represents the success rate in percentage. The chart shows how the success rate changes as the problem size increases for each difficulty level.
### Components/Axes
* **X-axis Title:** "Problem Size" (ranging from approximately 15 to 125)
* **Y-axis Title:** "Success Rate (%)" (ranging from 0 to 100)
* **Legend Title:** "Difficulty"
* **Legend Labels:**
* "easy" (represented by a solid blue line)
* "tricky" (represented by a dashed orange line)
* **Gridlines:** Present, providing a visual aid for reading values.
### Detailed Analysis
**Easy Difficulty (Blue Solid Line):**
The line starts at approximately 98% success rate at a problem size of 15. It initially decreases slightly to around 85% at a problem size of 20. Then, it rapidly drops to approximately 50% at a problem size of 35, and continues to decline to around 5% at a problem size of 60. From 60 to 120, the line remains relatively flat, hovering around 5% success rate.
* (15, 98)
* (20, 85)
* (35, 50)
* (40, 0)
* (60, 5)
* (120, 5)
**Tricky Difficulty (Orange Dashed Line):**
The line begins at approximately 100% success rate at a problem size of 15. It decreases to around 80% at a problem size of 20. It then drops sharply to approximately 35% at a problem size of 30, and then plummets to 0% at a problem size of 40. From 40 to 120, the line remains consistently at 0% success rate.
* (15, 100)
* (20, 80)
* (30, 35)
* (40, 0)
* (60, 0)
* (120, 0)
### Key Observations
* The "easy" difficulty maintains a significantly higher success rate than the "tricky" difficulty across all problem sizes.
* Both difficulties experience a sharp decline in success rate as the problem size increases.
* For the "tricky" difficulty, the success rate drops to 0% at a problem size of 40, and remains at 0% for larger problem sizes.
* The "easy" difficulty shows a more gradual decline in success rate, but still reaches a very low success rate (around 5%) for larger problem sizes.
### Interpretation
The data suggests that the problem difficulty has a substantial impact on the success rate. While the "easy" problems can be solved with a reasonable success rate for smaller problem sizes, both difficulty levels become increasingly challenging as the problem size grows. The "tricky" problems are particularly sensitive to problem size, with success rate dropping to zero relatively quickly. This could indicate that the algorithm or approach used for the "tricky" problems does not scale well with increasing problem size. The chart highlights the importance of considering problem complexity and scalability when designing algorithms or solving problems. The rapid decline in success rate for both difficulties suggests a potential computational limit or inherent difficulty in solving these types of problems beyond a certain size.