## Line Graphs: Per-Period Regret vs. Time Period for Different Agents
### Overview
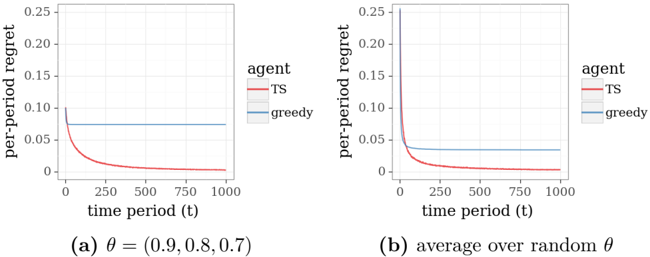
The image presents two line graphs comparing the per-period regret of two agents, "TS" (Thompson Sampling) and "greedy," over time. The x-axis represents the time period (t), ranging from 0 to 1000. The y-axis represents the per-period regret, ranging from 0 to 0.25. The left graph (a) shows results for a specific parameter set θ = (0.9, 0.8, 0.7), while the right graph (b) shows results averaged over random θ.
### Components/Axes
* **X-axis (Horizontal):** "time period (t)". Scale ranges from 0 to 1000, with tick marks at 0, 250, 500, 750, and 1000.
* **Y-axis (Vertical):** "per-period regret". Scale ranges from 0 to 0.25, with tick marks at 0, 0.05, 0.10, 0.15, 0.20, and 0.25.
* **Legend (Top-Right of each graph):**
* "TS" - Red line
* "greedy" - Blue line
* **Graph Titles:**
* (a) θ = (0.9, 0.8, 0.7)
* (b) average over random θ
### Detailed Analysis
**Graph (a): θ = (0.9, 0.8, 0.7)**
* **TS (Red Line):** The per-period regret starts at approximately 0.075 at time period 0 and rapidly decreases, approaching 0 as the time period increases. By time period 1000, the regret is close to 0.
* **Greedy (Blue Line):** The per-period regret remains relatively constant at approximately 0.075 across all time periods.
**Graph (b): Average over random θ**
* **TS (Red Line):** The per-period regret starts at approximately 0.225 at time period 0 and decreases rapidly, approaching 0 as the time period increases. By time period 1000, the regret is close to 0.
* **Greedy (Blue Line):** The per-period regret starts at approximately 0.08 at time period 0 and decreases slightly, stabilizing at approximately 0.035 as the time period increases.
### Key Observations
* In both graphs, the "TS" agent exhibits a decreasing per-period regret over time, indicating learning and improved performance.
* In graph (a), the "greedy" agent maintains a constant regret, suggesting no learning.
* In graph (b), the "greedy" agent shows a slight decrease in regret, but not as significant as the "TS" agent.
* The initial regret for the "TS" agent is much higher in graph (b) compared to graph (a), but it still converges to a low regret value.
### Interpretation
The graphs demonstrate that the Thompson Sampling (TS) agent consistently outperforms the greedy agent in terms of minimizing per-period regret over time. The TS agent's ability to learn and adapt to the environment results in a significant reduction in regret, while the greedy agent either maintains a constant regret or shows only a slight improvement. The difference in initial regret for the TS agent between the two graphs suggests that the performance of the TS agent is sensitive to the specific parameter set θ. However, even when averaged over random θ, the TS agent still converges to a low regret value, indicating its robustness and effectiveness.