## Line Charts: Per-Period Regret Comparison of TS and Greedy Agents
### Overview
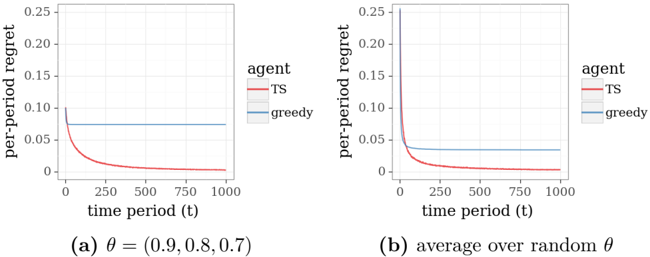
The image displays two side-by-side line charts comparing the performance of two agents, "TS" (Thompson Sampling) and "greedy," over time. The performance metric is "per-period regret." Chart (a) shows results for a specific parameter set, while chart (b) shows an average over random parameters. Both charts share identical axes and legend formatting.
### Components/Axes
* **Y-Axis (Both Charts):** Label is "per-period regret". Scale ranges from 0 to 0.25, with major tick marks at 0, 0.05, 0.10, 0.15, 0.20, and 0.25.
* **X-Axis (Both Charts):** Label is "time period (t)". Scale ranges from 0 to 1000, with major tick marks at 0, 250, 500, 750, and 1000.
* **Legend (Right side of each chart):** A box titled "agent" containing two entries:
* A red line segment labeled "TS".
* A blue line segment labeled "greedy".
* **Chart Titles/Captions (Below each chart):**
* **Chart (a):** `(a) θ = (0.9, 0.8, 0.7)`
* **Chart (b):** `(b) average over random θ`
### Detailed Analysis
**Chart (a): θ = (0.9, 0.8, 0.7)**
* **TS Agent (Red Line):** The line starts at a high per-period regret value of approximately 0.10 at t=0. It exhibits a steep, concave downward slope, decreasing rapidly. By t=250, the regret is very close to 0 (approx. 0.005 or less). From t=250 to t=1000, the line remains essentially flat at this near-zero level.
* **Greedy Agent (Blue Line):** The line starts at a per-period regret of approximately 0.075 at t=0. It is a perfectly horizontal line, showing no change over the entire time period from t=0 to t=1000. Its value remains constant at ~0.075.
**Chart (b): Average over random θ**
* **TS Agent (Red Line):** The line starts at a significantly higher initial regret compared to chart (a), at approximately 0.25 at t=0. It shows an even steeper initial decline. By t=125, the regret has already fallen below 0.05. By t=250, it is near zero (approx. 0.002 or less) and remains flat thereafter.
* **Greedy Agent (Blue Line):** The line starts at a per-period regret of approximately 0.05 at t=0. Similar to chart (a), it is a perfectly horizontal line, maintaining a constant value of ~0.05 from t=0 to t=1000.
### Key Observations
1. **Divergent Trends:** The two agents show fundamentally different behaviors. The TS agent's regret decreases sharply and converges to near-zero, indicating learning and improvement. The greedy agent's regret is constant, indicating no learning or adaptation over time.
2. **Initial Regret Difference:** The initial regret (at t=0) for the TS agent is higher than that of the greedy agent in both scenarios. This is particularly pronounced in the average case (chart b).
3. **Convergence Speed:** The TS agent converges to minimal regret quickly, within the first 250 time periods in both charts.
4. **Effect of Parameter Averaging:** Averaging over random θ (chart b) results in a higher initial regret for TS but a lower constant regret for the greedy agent, compared to the specific θ case in chart (a).
### Interpretation
These charts illustrate a classic comparison in multi-armed bandit or reinforcement learning problems between an exploration-based strategy (Thompson Sampling) and an exploitation-only strategy (greedy).
* **What the data suggests:** The TS agent successfully learns the optimal action over time, as evidenced by its per-period regret dropping to nearly zero. The initial high regret is the "cost" of exploration. The greedy agent, which always exploits the current best-known option without exploring, gets stuck in a suboptimal pattern, incurring a constant, non-zero regret indefinitely.
* **Relationship between elements:** The constant blue line serves as a baseline, showing the performance of a non-learning strategy. The decaying red line demonstrates the value of intelligent exploration. The difference between charts (a) and (b) suggests that the specific parameter configuration (θ) influences the magnitude of initial regret and the final constant regret level for the greedy agent, but the fundamental trend—TS learns, greedy does not—remains robust.
* **Notable Anomalies/Patterns:** The most striking pattern is the perfect flatness of the greedy agent's line. In a real-world scenario, one might expect some minor variance, but this idealized result clearly communicates the theoretical behavior of a pure greedy algorithm in a stationary environment. The sharp "elbow" in the TS curve around t=100-250 marks the transition from a primarily exploratory phase to a primarily exploitative phase where the optimal action has been identified.