## Line Graphs: Per-Period Regret Comparison Between TS and Greedy Agents
### Overview
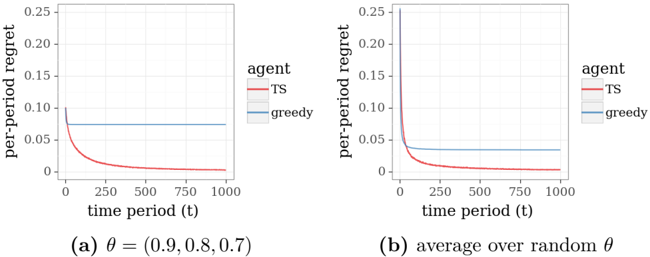
The image contains two side-by-side line graphs comparing the per-period regret of two agents ("TS" and "greedy") over time. Graph (a) shows results for a fixed θ = (0.9, 0.8, 0.7), while graph (b) shows averaged results over random θ values. Both graphs demonstrate how regret evolves across 1000 time periods.
### Components/Axes
- **X-axis**: Time period (t) ranging from 0 to 1000 in increments of 250
- **Y-axis**: Per-period regret (0 to 0.25 in 0.05 increments)
- **Legends**:
- Red line: "TS" agent
- Blue line: "greedy" agent
- **Graph Labels**:
- (a) θ = (0.9, 0.8, 0.7)
- (b) Average over random θ
### Detailed Analysis
#### Graph (a) θ = (0.9, 0.8, 0.7)
- **TS Agent (Red)**:
- Starts at ~0.15 regret at t=0
- Sharp decline to ~0.05 by t=250
- Plateaus at ~0.05 for t > 250
- **Greedy Agent (Blue)**:
- Starts at ~0.05 regret at t=0
- Remains flat at ~0.05 throughout all time periods
#### Graph (b) Average over random θ
- **TS Agent (Red)**:
- Starts at ~0.25 regret at t=0
- Sharp decline to ~0.05 by t=250
- Plateaus at ~0.05 for t > 250
- **Greedy Agent (Blue)**:
- Starts at ~0.05 regret at t=0
- Remains flat at ~0.05 throughout all time periods
### Key Observations
1. **Initial Regret Disparity**: TS agents consistently show higher initial regret than greedy agents in both scenarios.
2. **Convergence Pattern**: TS agents experience rapid regret reduction (within first 250 periods) and stabilize, while greedy agents maintain constant low regret.
3. **θ Sensitivity**: Fixed θ values (graph a) show slightly better TS performance than averaged random θ (graph b), suggesting parameter tuning impacts effectiveness.
### Interpretation
The data demonstrates that while TS agents begin with higher regret, they achieve faster convergence and maintain lower long-term regret compared to greedy agents. This suggests TS's adaptive learning mechanism (likely Thompson Sampling given the "TS" label) outperforms static greedy strategies in dynamic environments. The θ parameter set (0.9, 0.8, 0.7) in graph (a) appears optimized for faster convergence, while the averaged random θ in graph (b) represents more realistic uncertainty handling. The persistent flat line for greedy agents indicates their inability to adapt to changing conditions, making them less suitable for non-stationary environments despite their initial advantage.