## Heatmap: Unlabeled 6x6 Grid with Shade Intensity Legend
### Overview
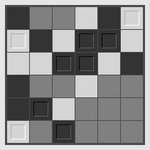
The image depicts a 6x6 grid of square cells with varying shades of gray and black. A legend in the top-right corner categorizes the shades from 0 (lightest) to 5 (darkest). No axis labels, titles, or textual annotations are present outside the legend.
### Components/Axes
- **Legend**: Located in the top-right corner, labeled with six entries:
- 0: Light gray (■)
- 1: Medium light gray (■)
- 2: Medium gray (■)
- 3: Medium dark gray (■)
- 4: Dark gray (■)
- 5: Black (■)
- **Grid**: 6 rows × 6 columns. No axis labels or numerical markers.
- **Color Coding**: Each cell’s shade corresponds to the legend’s numerical values.
### Detailed Analysis
- **Row 1 (Top)**: [4, 3, 3, 0, 4, 0]
- **Row 2**: [0, 4, 0, 5, 5, 0]
- **Row 3**: [0, 0, 5, 5, 0, 4]
- **Row 4**: [4, 5, 0, 0, 3, 3]
- **Row 5**: [5, 0, 4, 3, 2, 2]
- **Row 6 (Bottom)**: [0, 2, 5, 2, 2, 1]
### Key Observations
1. **Darkest Cells**: Shade 5 (black) appears in Row 2 (columns 4–5), Row 3 (columns 3–4), and Row 5 (column 1).
2. **Lightest Cells**: Shade 0 (light gray) dominates Row 1 (columns 4, 6), Row 2 (columns 1, 3, 6), and Row 6 (column 1).
3. **Middle Rows**: Rows 4–5 show a mix of medium to dark shades, with Row 5 having the highest concentration of dark gray (shade 4–5).
4. **Bottom-Right Corner**: Shade 1 (medium light gray) in Row 6, column 6, is the lightest in the bottom row.
### Interpretation
The grid resembles a heatmap, where darker shades (4–5) may represent higher values and lighter shades (0–1) lower values. However, without axis labels or contextual data, the exact meaning of the shades remains ambiguous. The distribution suggests:
- **Clustering of High Values**: Darker regions (shades 4–5) are concentrated in the middle and upper-middle rows.
- **Lightening Trend**: The bottom-right corner transitions to lighter shades, potentially indicating a gradient or decay effect.
- **No Clear Pattern**: The grid lacks symmetry or obvious trends, suggesting either random data or a visualization requiring additional context (e.g., axis labels, annotations).
### Limitations
- No textual data or axis labels are present beyond the legend.
- The absence of numerical values or units prevents quantitative analysis.
- The purpose of the grid (e.g., data visualization, artistic design) cannot be definitively determined.