\n
## Heatmaps: Neural Network Attention Visualization
### Overview
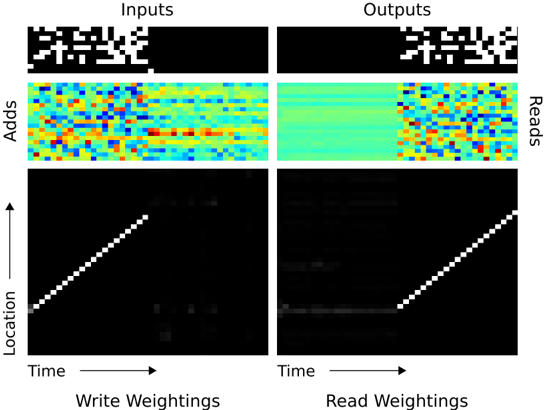
The image presents four heatmaps visualizing attention weights within a neural network, likely a recurrent neural network or transformer. The heatmaps are arranged in a 2x2 grid, labeled "Inputs" and "Outputs" on the top row, and "Write Weightings" and "Read Weightings" on the bottom row. Each heatmap displays a two-dimensional representation of attention, with "Time" on the x-axis and "Location" on the y-axis. The second row of heatmaps also has "Adds" and "Reads" on the y-axis. The color intensity represents the strength of the attention weight, ranging from blue (low attention) to red (high attention).
### Components/Axes
* **X-axis:** "Time" - Represents the temporal dimension of the sequence. The scale is not explicitly defined, but appears to be discrete steps.
* **Y-axis (Inputs/Outputs):** "Location" - Represents the position within the input or output sequence. The scale is not explicitly defined, but appears to be discrete steps.
* **Y-axis (Write/Read Weightings):** "Adds" and "Reads" - Represents the attention mechanism's focus on adding or reading information. The scale is not explicitly defined, but appears to be discrete steps.
* **Color Scale:** Blue to Red - Represents the magnitude of the attention weight. Blue indicates low attention, while red indicates high attention.
* **Labels:** "Inputs", "Outputs", "Write Weightings", "Read Weightings".
### Detailed Analysis or Content Details
**1. Inputs (Top-Left):**
* The heatmap shows a sparse pattern of attention weights.
* There are several bright red spots scattered across the heatmap, indicating strong attention at specific time and location combinations.
* The pattern appears somewhat random, with no clear dominant trend.
* Approximate dimensions: 20x20.
**2. Outputs (Top-Right):**
* The heatmap shows a more structured pattern of attention weights.
* There are several horizontal bands of high attention (red) spanning the entire width of the heatmap.
* These bands are separated by regions of low attention (blue).
* The bands suggest that the network is attending to different parts of the input sequence at different time steps.
* Approximate dimensions: 20x20.
**3. Write Weightings (Bottom-Left):**
* The heatmap shows a strong diagonal pattern, indicating that the network is primarily attending to the current time step and location.
* There are also several smaller, scattered red spots, indicating attention to other time and location combinations.
* The diagonal pattern suggests that the network is writing information to memory based on the current input.
* The diagonal line spans from approximately (0,0) to (20,20).
* There are a few scattered bright spots below the diagonal, indicating some attention to past time steps.
**4. Read Weightings (Bottom-Right):**
* The heatmap shows a similar diagonal pattern to the "Write Weightings" heatmap, but with a slightly less pronounced diagonal.
* There are also several scattered red spots, indicating attention to other time and location combinations.
* The diagonal pattern suggests that the network is reading information from memory based on the current time step.
* The diagonal line spans from approximately (0,0) to (20,20).
* There are a few scattered bright spots below the diagonal, indicating some attention to past time steps.
### Key Observations
* The "Inputs" heatmap shows a more diffuse attention pattern compared to the "Outputs" heatmap.
* The "Write Weightings" and "Read Weightings" heatmaps both exhibit a strong diagonal pattern, suggesting that the network is primarily attending to the current time step.
* The "Outputs" heatmap shows a clear pattern of horizontal bands, indicating that the network is attending to different parts of the input sequence at different time steps.
* The scattered red spots in all heatmaps suggest that the network is also attending to other time and location combinations, but to a lesser extent.
### Interpretation
The heatmaps provide a visual representation of the attention mechanism within a neural network. The "Inputs" heatmap shows how the network attends to the input sequence, while the "Outputs" heatmap shows how the network attends to the output sequence. The "Write Weightings" and "Read Weightings" heatmaps show how the network writes information to and reads information from memory.
The strong diagonal pattern in the "Write Weightings" and "Read Weightings" heatmaps suggests that the network is primarily attending to the current time step, which is consistent with the idea that the network is processing the input sequence sequentially. The horizontal bands in the "Outputs" heatmap suggest that the network is attending to different parts of the input sequence at different time steps, which is consistent with the idea that the network is learning to extract relevant information from the input sequence.
The scattered red spots in all heatmaps suggest that the network is also attending to other time and location combinations, which may be due to noise or to the network's ability to capture long-range dependencies. The difference in attention patterns between the "Inputs" and "Outputs" heatmaps suggests that the network is transforming the input sequence into a more structured representation in the output sequence.