TECHNICAL ASSET FINGERPRINT
ad96c743f32e1dd08e8f6e1f
Click to view fullscreen
Press ESC or click to close
FOUND IN PAPERS
EXPERT: healer-alpha-free VERSION 1
RUNTIME: free/openrouter/healer-alpha
INTEL_VERIFIED
\n
## Technical Diagram: Input/Output Processing with Weighting Matrices
### Overview
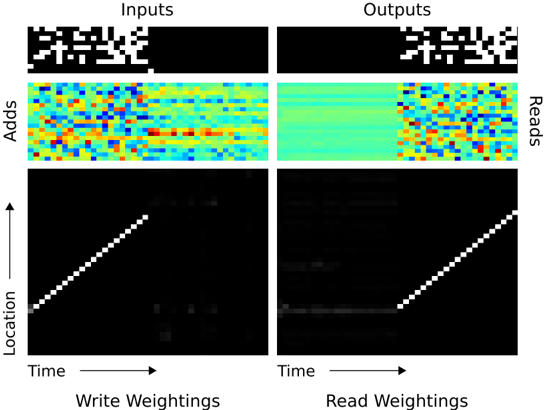
The image is a technical diagram illustrating a data processing or transformation system, likely related to neural networks, memory access, or signal processing. It is divided into two primary vertical columns labeled "Inputs" (left) and "Outputs" (right). Each column contains three vertically stacked panels showing different representations of data: binary patterns at the top, heatmaps in the middle, and diagonal line plots at the bottom. The diagram visually correlates input data with output data through intermediate representations and weighting schemes.
### Components/Axes
* **Primary Columns:**
* **Left Column Header:** "Inputs"
* **Right Column Header:** "Outputs"
* **Row Labels (Left Side):**
* Middle Row: "Adds" (y-axis label for the left heatmap).
* Bottom Row: "Location" (y-axis label for both bottom plots, with an upward-pointing arrow).
* **Row Labels (Right Side):**
* Middle Row: "Reads" (y-axis label for the right heatmap).
* **Bottom Row X-Axis:** Both bottom plots share an x-axis labeled "Time" with a rightward-pointing arrow.
* **Bottom Row Plot Titles:**
* Left Plot: "Write Weightings"
* Right Plot: "Read Weightings"
* **Color Scale (Implicit):** The middle row heatmaps use a color gradient from dark blue (low value) through green/yellow to red (high value). No explicit numerical legend is provided.
### Detailed Analysis
#### **Top Row: Binary Pattern Panels**
* **Inputs (Top-Left):** A rectangular grid of black and white pixels forming a complex, non-repeating binary pattern. It appears to be a matrix of approximately 16 rows by 32 columns. The pattern is dense with white pixels on the left half and becomes sparser towards the right.
* **Outputs (Top-Right):** A similar binary pattern grid. Its structure is distinct from the input pattern. It is sparse on the left half and becomes dense with white pixels on the right half. This suggests a transformation or mapping has occurred.
#### **Middle Row: Heatmap Panels**
* **Inputs / "Adds" (Middle-Left):** A heatmap with the same dimensions as the binary pattern above it. The color distribution shows high-intensity (red/yellow) values concentrated in horizontal bands, particularly in the lower half of the plot. The upper half shows more blue/green (lower values). The pattern is complex and does not show a simple gradient.
* **Outputs / "Reads" (Middle-Right):** A corresponding heatmap for the output. Its color distribution is markedly different. The left half is dominated by a uniform, low-intensity (green/cyan) color. The right half shows a complex, high-contrast pattern of blue, yellow, and red pixels, mirroring the density shift seen in the binary output pattern above.
#### **Bottom Row: Diagonal Line Plots**
* **Write Weightings (Bottom-Left):** A plot with "Location" (y-axis) vs. "Time" (x-axis). It displays a clear, bright white diagonal line composed of discrete dots or short segments. The line starts at the bottom-left corner (low location, early time) and extends to the top-right (high location, later time). This indicates a perfect linear relationship: as time progresses, the write operation addresses sequentially higher memory locations. The background is black with very faint, scattered noise.
* **Read Weightings (Bottom-Right):** A similar "Location" vs. "Time" plot. It also features a bright white diagonal line with the same slope and direction as the "Write Weightings" plot. However, this line is offset to the right along the time axis. It begins at a later time for the lowest location and ends at a later time for the highest location. This suggests the read operations follow the same sequential pattern as the writes but are delayed in time.
### Key Observations
1. **Symmetry and Transformation:** There is a clear visual symmetry between the "Inputs" and "Outputs" columns. The binary pattern and heatmap for outputs appear to be a transformed or processed version of the inputs, with a spatial shift in density (left-heavy to right-heavy).
2. **Temporal Sequencing:** The bottom plots establish a strict, sequential, time-ordered access pattern for both writing and reading data. The identical slope confirms the same addressing scheme is used.
3. **Read-Write Delay:** The horizontal offset between the "Write Weightings" and "Read Weightings" diagonals is a critical feature. It visually represents a latency or delay between when data is written to a location and when it is read back.
4. **Heatmap Correlation:** The complex patterns in the "Adds" heatmap likely represent the activation or values being written. The "Reads" heatmap shows that reading primarily accesses the dense (right-side) portion of the output data, corresponding to the later time steps in the read weighting diagonal.
### Interpretation
This diagram illustrates the core mechanics of a **sequential memory or buffer system**, possibly a content-addressable memory, a shift register, or a neural network layer with precise timing.
* **Process Flow:** Input data (top-left binary pattern) is processed, generating a set of values or activations ("Adds" heatmap). These values are written into a memory structure in a strict, sequential order over time, as shown by the "Write Weightings" diagonal. After a fixed delay, the system reads from the same memory structure in the same sequential order, as shown by the offset "Read Weightings" diagonal. The read operation retrieves the processed data, resulting in the output pattern (top-right).
* **Underlying Principle:** The system enforces a deterministic, time-based access protocol. The data's spatial organization in the output (right-side density) is a direct consequence of the temporal sequence of writes and the delayed reads. The heatmaps provide a view into the *content* being moved, while the bottom plots define the *protocol* for moving it.
* **Notable Anomaly/Feature:** The most significant feature is the **read-write latency**. This delay is fundamental to the system's operation, allowing for processing pipelines, preventing read/write conflicts, or enabling temporal data alignment. The perfect diagonals suggest an idealized or simulated system without jitter or variable latency.
* **Purpose:** The diagram serves to explain how a specific input is transformed into a specific output via a timed, weighted access scheme. It emphasizes the relationship between time, memory location, and data value.
DECODING INTELLIGENCE...