## Line Graph: Accuracy vs Compute (exaFLOP)
### Overview
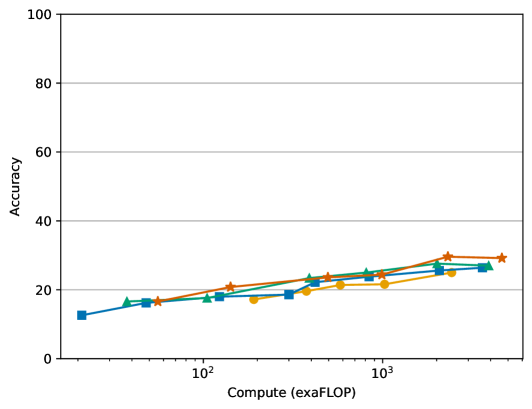
The graph illustrates the relationship between computational power (measured in exaFLOP) and accuracy across four distinct algorithms or models. Accuracy is plotted on the y-axis (0–100%), while compute is logarithmic on the x-axis (10² to 10⁴ exaFLOP). Four data series are represented by colored lines with unique markers.
### Components/Axes
- **X-axis (Compute)**: Labeled "Compute (exaFLOP)" with logarithmic scale markers at 10², 10³, and 10⁴.
- **Y-axis (Accuracy)**: Labeled "Accuracy" with linear scale markers at 20, 40, 60, 80, and 100.
- **Legend**: Located in the top-right corner, associating:
- Blue squares (Line 1)
- Green triangles (Line 2)
- Orange circles (Line 3)
- Red stars (Line 4)
### Detailed Analysis
1. **Line 1 (Blue Squares)**:
- Starts at ~10 exaFLOP with ~15% accuracy.
- Gradually increases to ~25% at 10⁴ exaFLOP.
- Slope is relatively flat compared to other lines.
2. **Line 2 (Green Triangles)**:
- Begins at ~10 exaFLOP with ~18% accuracy.
- Rises to ~27% at 10⁴ exaFLOP.
- Shows moderate upward trend.
3. **Line 3 (Orange Circles)**:
- Starts at ~10 exaFLOP with ~16% accuracy.
- Peaks at ~25% at 10³ exaFLOP, then plateaus.
- Shows early saturation.
4. **Line 4 (Red Stars)**:
- Begins at ~10 exaFLOP with ~17% accuracy.
- Reaches ~30% at 10⁴ exaFLOP.
- Steepest slope, highest final accuracy.
### Key Observations
- All lines exhibit upward trends, confirming that increased compute correlates with higher accuracy.
- Line 4 (red stars) achieves the highest accuracy (~30%) but plateaus earlier than others.
- Lines 1 and 2 show similar performance, with Line 2 slightly outperforming Line 1.
- Line 3 (orange circles) saturates fastest, reaching its peak at 10³ exaFLOP.
### Interpretation
The graph demonstrates that computational power improves model accuracy, but diminishing returns occur at higher exaFLOP thresholds. Line 4’s algorithm appears most efficient, achieving the highest accuracy with moderate compute. Lines 1 and 2 suggest scalability with fewer diminishing returns, while Line 3’s early saturation implies architectural or algorithmic limitations. The data underscores the trade-off between resource allocation and performance gains in high-performance computing systems.