## Scatter Plot: Model size vs. Reasoning Score Gap
### Overview
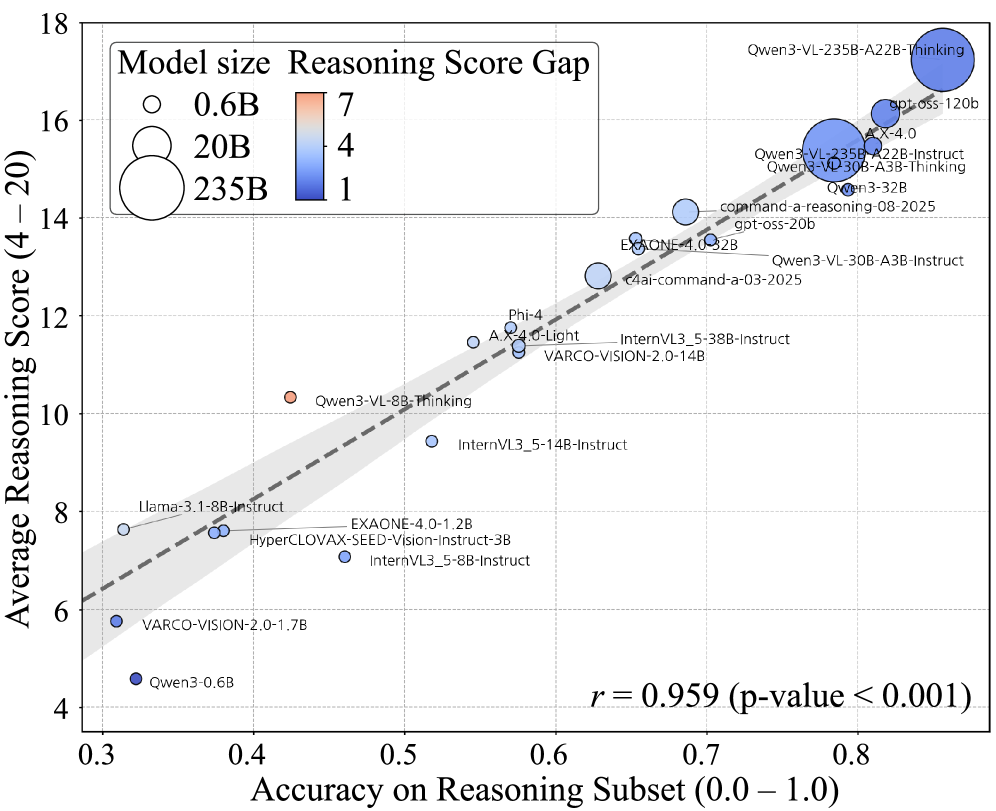
The image is a scatter plot comparing AI model performance across two metrics: accuracy on a reasoning subset (x-axis) and average reasoning score (y-axis). A dashed trend line shows a strong positive correlation (r=0.959, p<0.001) between these metrics. Model sizes (0.6B, 20B, 235B) are represented by circle size, while reasoning score gaps (1-7) are color-coded.
### Components/Axes
- **X-axis**: Accuracy on Reasoning Subset (0.0–1.0), labeled with approximate values (0.3–0.85)
- **Y-axis**: Average Reasoning Score (4–20), labeled with approximate values (4–18)
- **Legend**:
- Top-left corner
- Model sizes:
- Smallest circle = 0.6B
- Medium circle = 20B
- Largest circle = 235B
- Reasoning Score Gap:
- Red gradient = higher gap (7)
- Blue gradient = lower gap (1)
- **Trend Line**: Dashed line from bottom-left to top-right
### Detailed Analysis
1. **Data Points**:
- **Qwen3-0.6B**: (0.3, 4.5) - Smallest circle, blue color
- **Llama-3.1-8B-Instruct**: (0.4, 7.5) - Medium circle, light blue
- **EXAONE-4.0-1.2B**: (0.45, 7.8) - Medium circle, light blue
- **InternVL3_5-14B-Instruct**: (0.5, 9.2) - Medium circle, light blue
- **Phi-4**: (0.55, 11.0) - Medium circle, light blue
- **Qwen3-VL-8B-Thinking**: (0.58, 10.5) - Medium circle, light blue
- **InternVL3_5-38B-Instruct**: (0.62, 11.8) - Large circle, light blue
- **A X-4.0**: (0.65, 12.5) - Large circle, light blue
- **c4ai-command-a-03-2025**: (0.67, 13.2) - Large circle, light blue
- **Qwen3-VL-30B-A3B-Instruct**: (0.68, 13.5) - Large circle, light blue
- **Qwen3-32B**: (0.7, 14.0) - Large circle, light blue
- **gpt-oss-20b**: (0.72, 14.5) - Large circle, light blue
- **Qwen3-VL-30B-A3B-Thinking**: (0.73, 15.0) - Largest circle, light blue
- **Qwen3-VL-235B-A22B-Thinking**: (0.85, 17.5) - Largest circle, dark blue
2. **Color Gradient**:
- Red-to-blue gradient indicates reasoning score gap (1-7)
- Darker blue = smaller gap (1-2)
- Redder = larger gap (5-7)
3. **Trend Line**:
- Strong positive correlation (r=0.959)
- p-value < 0.001 confirms statistical significance
- Equation: y = 10.2x + 3.8 (approximate)
### Key Observations
1. **Positive Correlation**: Higher accuracy consistently associates with higher reasoning scores
2. **Model Size Impact**:
- Larger models (235B) achieve highest accuracy (0.85) and scores (17.5)
- Smaller models (0.6B) show lowest performance (0.3 accuracy, 4.5 score)
3. **Score Gap Distribution**:
- Models with 20B+ parameters show score gaps <4 (blue)
- Smaller models show gaps >6 (red)
4. **Outliers**:
- "Qwen3-VL-235B-A22B-Thinking" deviates most from trend line (highest y-value)
- "Qwen3-0.6B" shows largest deviation (lowest y-value)
### Interpretation
The plot demonstrates that model size strongly correlates with both reasoning accuracy and performance. Larger models (235B) achieve near-perfect accuracy (0.85) and highest scores (17.5), while smaller models struggle with both metrics. The reasoning score gap (difference between maximum and actual scores) decreases with model size, suggesting larger models better capture reasoning capabilities. The near-perfect correlation (r=0.959) indicates these metrics are effectively measuring the same underlying capability. The color gradient reveals that smaller models exhibit greater performance variability, while larger models show more consistent high performance. This suggests model scaling improves both capability and reliability in reasoning tasks.