## Line Chart: Model Performance Scores by Graphwalks Type and Size
### Overview
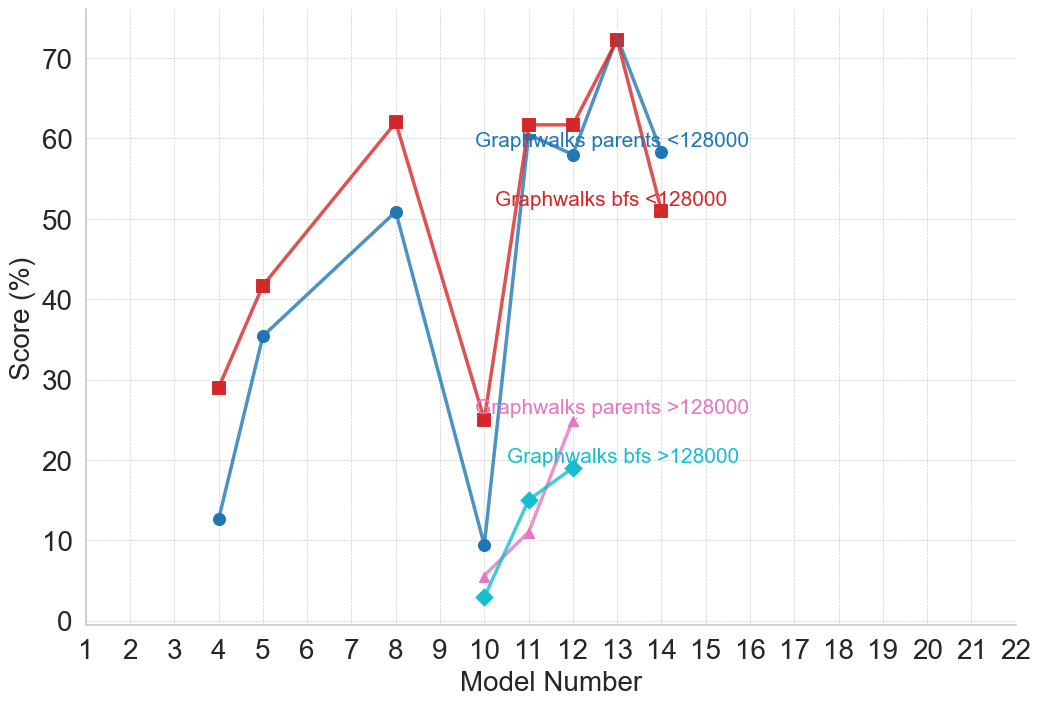
This image is a 2D line chart displaying the performance "Score (%)" of various "Model Numbers" across four different configurations related to "Graphwalks". The chart compares two methods ("parents" and "bfs") across two size/complexity thresholds ("<128000" and ">128000"). The data reveals high volatility in performance across different models for the smaller threshold, and consistently low performance for the larger threshold on a limited subset of models.
### Components/Axes
**1. Y-Axis (Vertical, Left)**
* **Title:** "Score (%)" (Rotated 90 degrees counter-clockwise, centered vertically).
* **Scale:** Linear, ranging from 0 to 70 (with gridlines extending slightly above 70).
* **Markers:** 0, 10, 20, 30, 40, 50, 60, 70.
**2. X-Axis (Horizontal, Bottom)**
* **Title:** "Model Number" (Centered horizontally below the axis).
* **Scale:** Linear, discrete integer values.
* **Markers:** 1, 2, 3, 4, 5, 6, 7, 8, 9, 10, 11, 12, 13, 14, 15, 16, 17, 18, 19, 20, 21, 22.
**3. Gridlines**
* Light gray, dashed gridlines intersect at every major tick mark on both the X and Y axes.
**4. Legend (Inline)**
There is no separate legend box. Instead, text labels are placed directly on the chart area, color-coded to match their respective data series.
* **Blue Text** (Top center, near X=10-14): `Graphwalks parents <128000` (Corresponds to the Blue line with circle markers).
* **Red Text** (Below blue text, near X=10-14): `Graphwalks bfs <128000` (Corresponds to the Red line with square markers).
* **Pink Text** (Middle right, near X=10-14): `Graphwalks parents >128000` (Corresponds to the Pink line with triangle markers).
* **Teal Text** (Below pink text, near X=10-14): `Graphwalks bfs >128000` (Corresponds to the Teal line with diamond markers).
---
### Detailed Analysis
*Note: All Y-axis values are approximate (denoted by ~) based on visual interpolation between the gridlines.*
**Series 1: Graphwalks parents <128000 (Blue Line, Circle Markers)**
* **Visual Trend:** The line starts low, rises steadily to a peak at Model 8, crashes significantly at Model 10, rebounds sharply to a high plateau at Models 11-12, peaks at Model 13, and drops at Model 14.
* **Data Points:**
* Model 4: ~13%
* Model 5: ~35%
* Model 8: ~51%
* Model 10: ~9%
* Model 11: ~60%
* Model 12: ~58%
* Model 13: ~72%
* Model 14: ~58%
**Series 2: Graphwalks bfs <128000 (Red Line, Square Markers)**
* **Visual Trend:** This line closely mirrors the shape of Series 1 but generally scores higher. It rises to a peak at Model 8, crashes at Model 10, rebounds sharply to a plateau at Models 11-12, peaks at Model 13, and drops sharply at Model 14.
* **Data Points:**
* Model 4: ~29%
* Model 5: ~42%
* Model 8: ~62%
* Model 10: ~25%
* Model 11: ~62%
* Model 12: ~62%
* Model 13: ~72%
* Model 14: ~51%
**Series 3: Graphwalks parents >128000 (Pink Line, Triangle Markers)**
* **Visual Trend:** This series only exists for a short span (Models 10-12). It starts very low and slopes upward steadily.
* **Data Points:**
* Model 10: ~5%
* Model 11: ~11%
* Model 12: ~25%
**Series 4: Graphwalks bfs >128000 (Teal Line, Diamond Markers)**
* **Visual Trend:** Similar to Series 3, this only exists for Models 10-12. It starts very low and slopes upward, crossing over Series 3.
* **Data Points:**
* Model 10: ~3%
* Model 11: ~15%
* Model 12: ~19%
---
### Key Observations
1. **Missing Data:** There are significant gaps in the data. Models 1, 2, 3, 6, 7, 9, and 15 through 22 have no data points plotted for any series.
2. **Performance Disparity by Size:** The `<128000` configurations score vastly higher (ranging from ~9% to ~72%) than the `>128000` configurations (ranging from ~3% to ~25%).
3. **The "Model 10" Anomaly:** Model 10 represents a massive drop in performance for the `<128000` tasks compared to Models 8 and 11. Interestingly, it is also the starting point for the `>128000` evaluations.
4. **Method Comparison (bfs vs. parents):** For the `<128000` category, the "bfs" method (red) consistently outperforms the "parents" method (blue) from Models 4 through 12. They tie at Model 13, and then "parents" overtakes "bfs" at Model 14.
5. **Peak Performance:** Model 13 achieves the highest score (~72%) for both the "bfs" and "parents" methods in the `<128000` category.
---
### Interpretation
* **Contextual Meaning:** The chart likely evaluates the performance of different iterations or architectures of a machine learning model (Models 1-22) on a specific task involving graph traversal or generation ("Graphwalks").
* **Task Complexity:** The threshold `128000` likely refers to a measure of complexity, such as the number of nodes/edges in a graph, context window size, or dataset size. The data clearly demonstrates that the models struggle significantly when this complexity threshold is exceeded (`>128000`), yielding scores below 25%.
* **Algorithmic Differences:** "bfs" (Breadth-First Search) and "parents" likely refer to two different algorithmic approaches or evaluation metrics used during the graphwalks. The data suggests that "bfs" is generally a more successful or stable approach for the less complex tasks, though the advantage disappears at the highest performing model (Model 13).
* **Model Evolution:** The erratic nature of the `<128000` lines suggests that "Model Number" represents distinct architectural changes rather than a smooth training progression (epochs). For example, whatever architectural change was introduced in Model 10 severely degraded performance on the easier tasks, but subsequent models (11-13) fixed this issue and achieved state-of-the-art results for this chart.
* **Resource Constraints/Testing Scope:** The fact that the `>128000` tasks were only tested on Models 10, 11, and 12 suggests that earlier models (4-8) might have been incapable of running these larger tasks (e.g., due to out-of-memory errors), or that the researchers only decided to introduce the harder benchmark once the models reached a certain maturity. The lack of data beyond Model 14 suggests testing was halted or those models are not yet evaluated.