## Line Chart: Model Score Comparison
### Overview
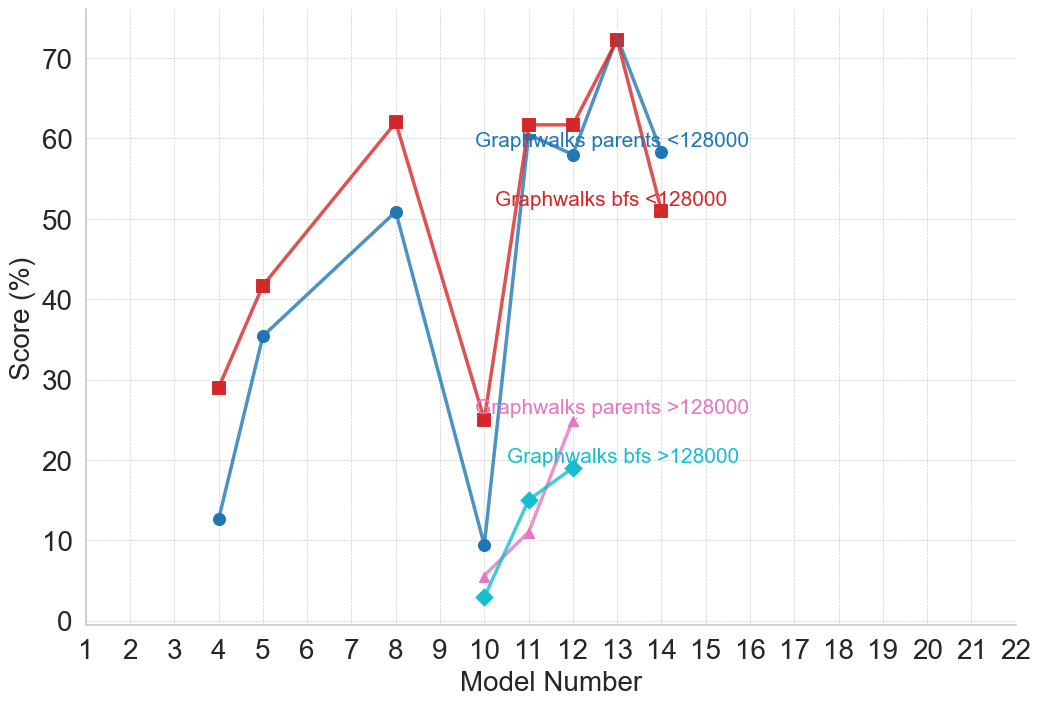
The image is a line chart comparing the scores of different models, specifically Graphwalks, using two different algorithms (parents and bfs) and two different size thresholds (<128000 and >128000). The x-axis represents the model number, and the y-axis represents the score in percentage.
### Components/Axes
* **X-axis:** "Model Number", ranging from 1 to 22 with integer increments.
* **Y-axis:** "Score (%)", ranging from 0 to 70 with increments of 10.
* **Legend (Top-Right):**
* Blue: "Graphwalks parents <128000"
* Red: "Graphwalks bfs <128000"
* Pink: "Graphwalks parents >128000"
* Cyan: "Graphwalks bfs >128000"
### Detailed Analysis
* **Graphwalks parents <128000 (Blue):**
* Model 4: Approximately 12
* Model 5: Approximately 35
* Model 8: Approximately 51
* Model 10: Approximately 10
* Model 11: Approximately 60
* Model 13: Approximately 71
* Model 14: Approximately 51
*Trend:* The blue line starts low, increases sharply to model 8, drops sharply to model 10, then increases sharply again to model 13, before decreasing to model 14.
* **Graphwalks bfs <128000 (Red):**
* Model 4: Approximately 29
* Model 5: Approximately 42
* Model 8: Approximately 62
* Model 10: Approximately 26
* Model 11: Approximately 62
* Model 13: Approximately 72
* Model 14: Approximately 52
*Trend:* The red line starts at a moderate value, increases to model 8, decreases to model 10, increases again to model 13, and then decreases to model 14.
* **Graphwalks parents >128000 (Pink):**
* Model 10: Approximately 10
* Model 11: Approximately 11
* Model 12: Approximately 16
*Trend:* The pink line shows a slight upward trend from model 10 to model 12.
* **Graphwalks bfs >128000 (Cyan):**
* Model 10: Approximately 2
* Model 11: Approximately 15
* Model 12: Approximately 19
*Trend:* The cyan line shows an upward trend from model 10 to model 12.
### Key Observations
* The "Graphwalks parents <128000" (blue) and "Graphwalks bfs <128000" (red) lines have similar trends, with peaks at model 8 and model 13.
* The "Graphwalks parents >128000" (pink) and "Graphwalks bfs >128000" (cyan) lines have much lower scores compared to the other two lines.
* The data for "Graphwalks parents >128000" and "Graphwalks bfs >128000" is only available for models 10, 11, and 12.
### Interpretation
The chart compares the performance of Graphwalks models using different configurations. The models with a size threshold of less than 128000 (blue and red lines) generally perform better than those with a size threshold greater than 128000 (pink and cyan lines). The peaks at model numbers 8 and 13 for the <128000 models suggest that these models are particularly effective. The limited data for the >128000 models makes it difficult to draw definitive conclusions about their performance, but the available data suggests they are less effective than the <128000 models. The choice of algorithm (parents vs. bfs) seems to have a less significant impact on performance than the size threshold.