# Technical Document Extraction: Line Chart Analysis
## 1. Axis Labels and Markers
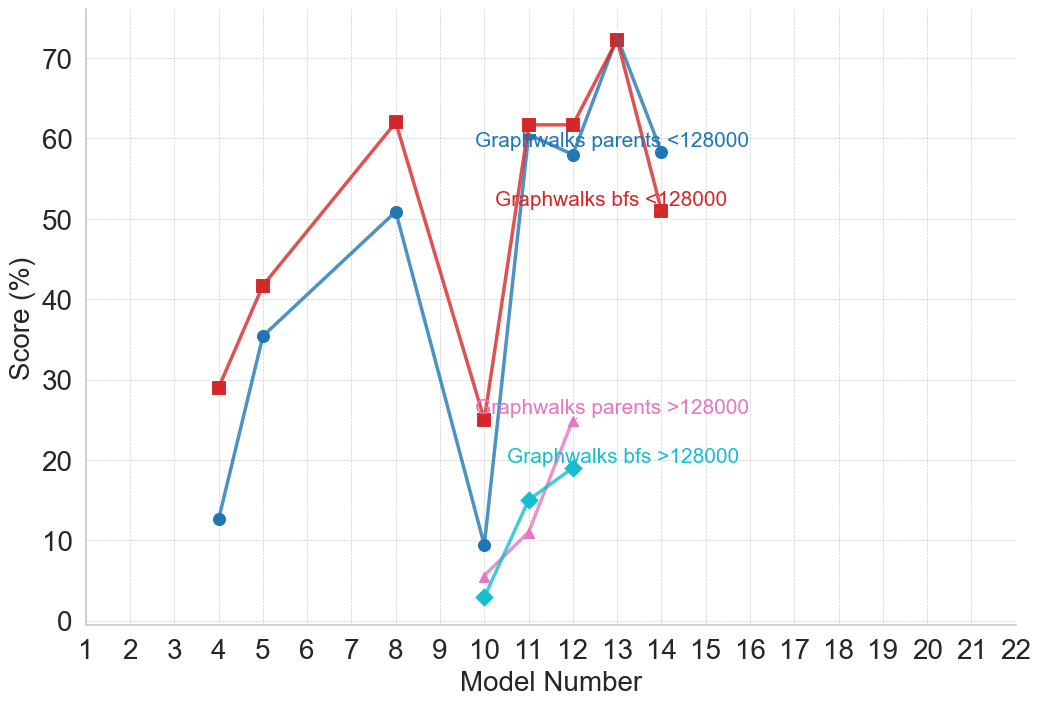
- **X-axis**: Model Number (1–22)
- **Y-axis**: Score (%) (0–70)
- **Legend**: Located at top-right corner
- Blue: Graphwalks parents
- Red: Graphwalks bfs
- Magenta: Graphwalks parents >128000
## 2. Data Series Analysis
### A. Graphwalks parents (Blue Line)
- **Trend**:
- Initial rise from 12% (Model 4) to 51% (Model 8)
- Sharp decline to 9% (Model 10)
- Rapid ascent to 72% (Model 13)
- Post-peak decline to 58% (Model 14)
- **Key Points**:
- Model 4: 12%
- Model 8: 51%
- Model 10: 9%
- Model 13: 72%
- Model 14: 58%
### B. Graphwalks bfs (Red Line)
- **Trend**:
- Initial rise from 29% (Model 4) to 62% (Model 8)
- Sharp decline to 25% (Model 10)
- Rapid ascent to 72% (Model 13)
- Post-peak decline to 51% (Model 14)
- **Key Points**:
- Model 4: 29%
- Model 8: 62%
- Model 10: 25%
- Model 13: 72%
- Model 14: 51%
### C. Graphwalks parents >128000 (Magenta Line)
- **Trend**:
- Initial rise from 3% (Model 10) to 25% (Model 12)
- Sharp decline to 10% (Model 14)
- **Key Points**:
- Model 10: 3%
- Model 12: 25%
- Model 14: 10%
## 3. Annotations
- **Model 14**:
- "Graphwalks parents <128000" (Blue line)
- "Graphwalks bfs <128000" (Red line)
- **Model 12**:
- "Graphwalks parents >128000" (Magenta line)
## 4. Spatial Grounding
- **Legend Position**: Top-right quadrant
- **Data Point Color Verification**:
- Blue points match "Graphwalks parents"
- Red points match "Graphwalks bfs"
- Magenta points match "Graphwalks parents >128000"
## 5. Trend Verification
- **Graphwalks parents**:
- Steep upward slope (Model 4→8)
- Sharp V-shaped dip (Model 8→10)
- Steep upward slope (Model 10→13)
- Gradual decline (Model 13→14)
- **Graphwalks bfs**:
- Steeper initial ascent than Graphwalks parents
- Similar V-shaped dip pattern
- Identical peak at Model 13
- Slightly less pronounced post-peak decline
- **Graphwalks parents >128000**:
- Shallow initial rise
- Steep decline post-peak
## 6. Critical Observations
1. Both Graphwalks parents and bfs achieve identical maximum scores (72%) at Model 13
2. Graphwalks parents >128000 shows significantly lower performance across all models
3. Model 10 represents a performance trough for all data series
4. Post-peak decline (Model 13→14) is more pronounced for Graphwalks parents than bfs
## 7. Data Table Reconstruction
| Model | Graphwalks parents | Graphwalks bfs | Graphwalks parents >128000 |
|-------|--------------------|----------------|----------------------------|
| 4 | 12% | 29% | - |
| 8 | 51% | 62% | - |
| 10 | 9% | 25% | 3% |
| 12 | 58% | 62% | 25% |
| 13 | 72% | 72% | - |
| 14 | 58% | 51% | 10% |
## 8. Language Analysis
- **Primary Language**: English
- **No secondary languages detected**
## 9. Structural Components
1. Header: Chart title (implied by axis labels)
2. Main Chart: Three-line plot with annotations
3. Footer: Legend and axis markers