# Technical Document Extraction: Accuracy vs. Base Value Chart
## 1. Component Isolation
* **Header:** None present.
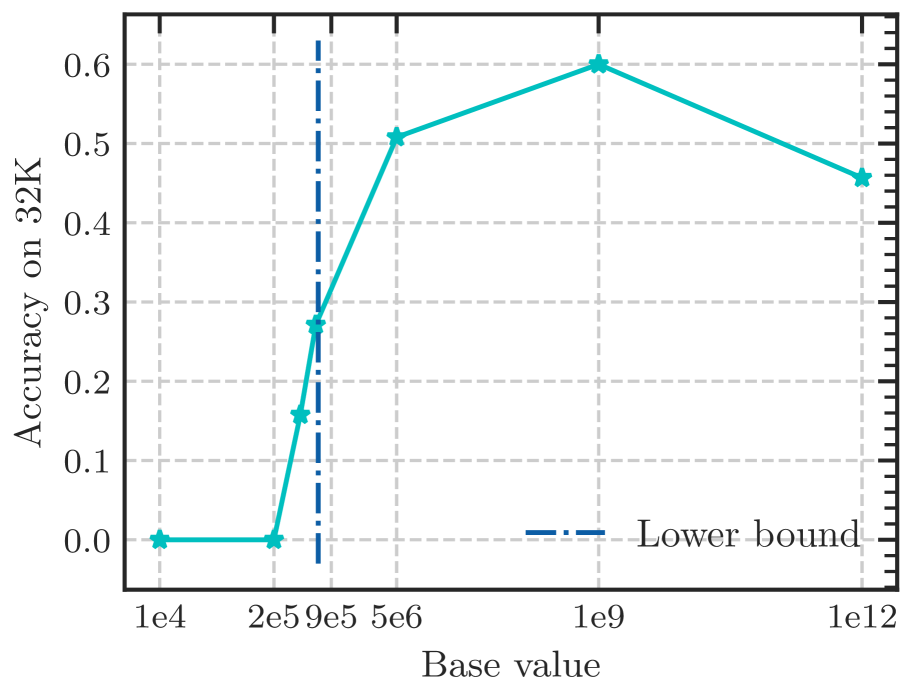
* **Main Chart Area:** A line graph with a logarithmic-style x-axis and a linear y-axis. It features a single data series (teal line with star markers) and a vertical reference line (dark blue dash-dotted line).
* **Legend:** Located in the bottom-right quadrant of the plot area.
* **Footer/Axes:** X-axis labeled "Base value" and Y-axis labeled "Accuracy on 32K".
---
## 2. Axis and Metadata Extraction
* **Y-Axis (Vertical):**
* **Label:** Accuracy on 32K
* **Scale:** Linear, ranging from 0.0 to 0.6.
* **Major Tick Marks:** 0.0, 0.1, 0.2, 0.3, 0.4, 0.5, 0.6.
* **X-Axis (Horizontal):**
* **Label:** Base value
* **Scale:** Non-linear/Logarithmic-style spacing.
* **Major Tick Labels:** 1e4, 2e5, 9e5, 5e6, 1e9, 1e12.
* **Grid:** Light gray dashed horizontal and vertical grid lines corresponding to major ticks.
* **Legend [Spatial Grounding: Bottom Right]:**
* **Label:** "Lower bound"
* **Style:** Dark blue dash-dotted line (`- . - .`).
---
## 3. Data Series Analysis
### Series 1: Accuracy Data
* **Color:** Teal / Cyan.
* **Marker:** 5-point star.
* **Trend Verification:** The line starts at zero for low base values, exhibits a sharp upward slope between $2 \times 10^5$ and $1 \times 10^9$, reaches a peak at $1 \times 10^9$, and then shows a slight downward slope toward $1 \times 10^{12}$.
| Base value (X) | Accuracy on 32K (Y) | Notes |
| :--- | :--- | :--- |
| 1e4 | 0.0 | Baseline zero |
| 2e5 | 0.0 | Remains at zero |
| ~5e5* | ~0.16 | Intermediate point (unlabeled x-tick) |
| 9e5 | ~0.27 | Sharp increase |
| 5e6 | ~0.51 | Continued sharp increase |
| 1e9 | 0.6 | **Peak Accuracy** |
| 1e12 | ~0.46 | Performance degradation |
*\*Note: There is a data point between 2e5 and 9e5 that is not explicitly labeled on the x-axis but aligns with the vertical grid line.*
### Reference Element: Lower Bound
* **Color:** Dark Blue.
* **Style:** Vertical dash-dotted line.
* **Placement:** Positioned at the x-axis value of **9e5**.
* **Intersection:** This line intersects the teal data series at an accuracy of approximately 0.27.
---
## 4. Summary of Findings
This chart illustrates the relationship between a "Base value" and the "Accuracy on 32K".
1. **Inertia Phase:** For base values at or below $2 \times 10^5$, the accuracy is effectively 0.0.
2. **Growth Phase:** A rapid improvement in accuracy occurs as the base value increases from $2 \times 10^5$ to $1 \times 10^9$.
3. **Critical Threshold:** The "Lower bound" is marked at $9 \times 10^5$, which represents the point where accuracy has climbed to roughly 27%.
4. **Optimal Point:** Maximum accuracy (0.6) is achieved when the base value is $1 \times 10^9$.
5. **Saturation/Regression:** Increasing the base value further to $1 \times 10^{12}$ results in a decrease in accuracy to approximately 0.46, suggesting an over-optimization or diminishing returns beyond the $10^9$ threshold.