## Bar Chart: Accuracy by Condition
### Overview
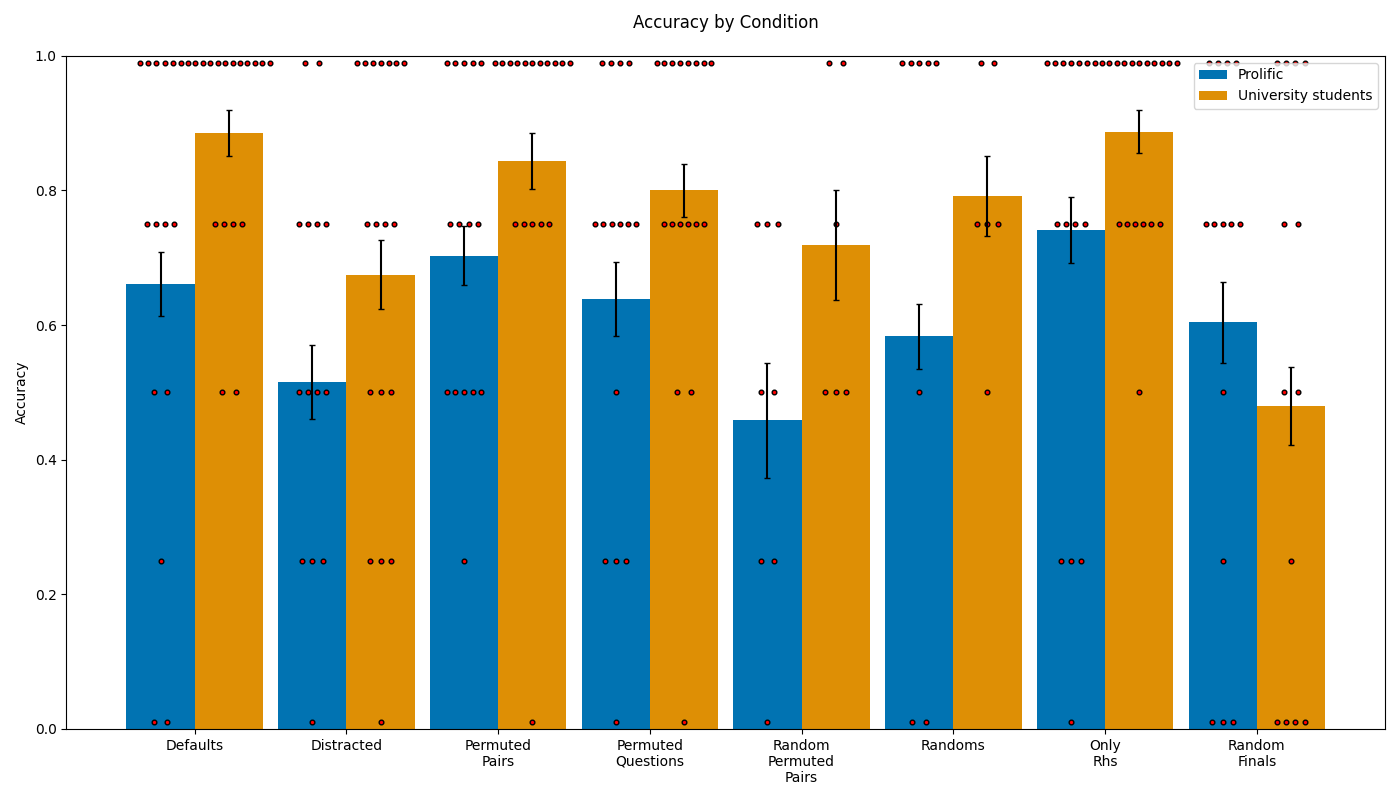
The image is a bar chart comparing the accuracy of two groups, "Prolific" and "University students," across different experimental conditions. The y-axis represents accuracy, ranging from 0.0 to 1.0. The x-axis represents the different conditions: "Defaults," "Distracted," "Permuted Pairs," "Permuted Questions," "Random Permuted Pairs," "Randoms," "Only Rhs," and "Random Finals." Error bars are included on each bar, indicating variability. Small red dots are scattered around each bar, possibly representing individual data points.
### Components/Axes
* **Title:** Accuracy by Condition
* **Y-axis:** Accuracy, ranging from 0.0 to 1.0 in increments of 0.2.
* **X-axis:**
* Defaults
* Distracted
* Permuted Pairs
* Permuted Questions
* Random Permuted Pairs
* Randoms
* Only Rhs
* Random Finals
* **Legend (Top-Right):**
* Blue: Prolific
* Orange: University students
### Detailed Analysis
Here's a breakdown of the accuracy for each condition, including approximate values and trends:
* **Defaults:**
* Prolific (Blue): Accuracy around 0.66, with error bars extending from approximately 0.6 to 0.72.
* University students (Orange): Accuracy around 0.89, with error bars extending from approximately 0.83 to 0.95.
* **Distracted:**
* Prolific (Blue): Accuracy around 0.52, with error bars extending from approximately 0.46 to 0.58.
* University students (Orange): Accuracy around 0.68, with error bars extending from approximately 0.62 to 0.74.
* **Permuted Pairs:**
* Prolific (Blue): Accuracy around 0.71, with error bars extending from approximately 0.65 to 0.77.
* University students (Orange): Accuracy around 0.84, with error bars extending from approximately 0.78 to 0.90.
* **Permuted Questions:**
* Prolific (Blue): Accuracy around 0.64, with error bars extending from approximately 0.58 to 0.70.
* University students (Orange): Accuracy around 0.80, with error bars extending from approximately 0.74 to 0.86.
* **Random Permuted Pairs:**
* Prolific (Blue): Accuracy around 0.46, with error bars extending from approximately 0.40 to 0.52.
* University students (Orange): Accuracy around 0.72, with error bars extending from approximately 0.66 to 0.78.
* **Randoms:**
* Prolific (Blue): Accuracy around 0.59, with error bars extending from approximately 0.53 to 0.65.
* University students (Orange): Accuracy around 0.79, with error bars extending from approximately 0.73 to 0.85.
* **Only Rhs:**
* Prolific (Blue): Accuracy around 0.75, with error bars extending from approximately 0.69 to 0.81.
* University students (Orange): Accuracy around 0.89, with error bars extending from approximately 0.83 to 0.95.
* **Random Finals:**
* Prolific (Blue): Accuracy around 0.61, with error bars extending from approximately 0.55 to 0.67.
* University students (Orange): Accuracy around 0.48, with error bars extending from approximately 0.42 to 0.54.
### Key Observations
* University students generally have higher accuracy than Prolific participants across most conditions, except for "Random Finals."
* The "Random Permuted Pairs" condition shows the lowest accuracy for both groups.
* The "Defaults" and "Only Rhs" conditions show the highest accuracy for University students.
### Interpretation
The bar chart suggests that the "University students" group generally performs better in terms of accuracy compared to the "Prolific" group across various experimental conditions. The "Random Permuted Pairs" condition appears to be the most challenging for both groups, indicating that this specific manipulation significantly impacts accuracy. The scattered red dots could represent individual data points, providing a visual representation of the distribution of accuracy within each group and condition. The error bars indicate the variability within each condition, with larger error bars suggesting more variation in accuracy among participants. The "Random Finals" condition is an outlier, where the "Prolific" group shows higher accuracy than the "University students" group. This could be due to various factors, such as differences in test-taking strategies or prior knowledge between the two groups.