## Bar Chart: Accuracy by Condition
### Overview
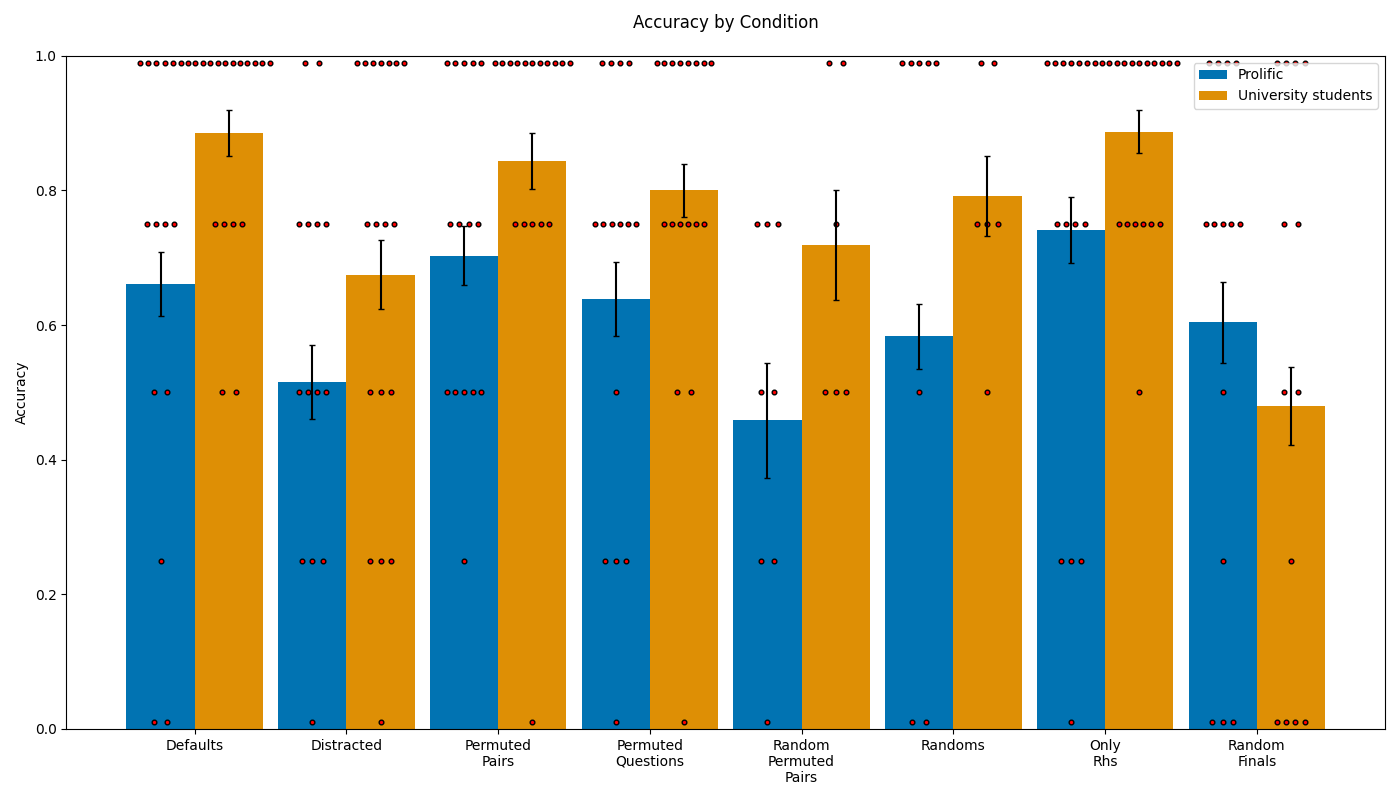
The chart compares the accuracy of two groups ("Prolific" and "University students") across eight experimental conditions. Accuracy is measured on a scale from 0 to 1, with error bars representing variability and red dots indicating statistical significance (p-values). The legend confirms blue bars represent "Prolific" and orange bars represent "University students."
### Components/Axes
- **X-axis**: Conditions (Defaults, Distracted, Permuted Pairs, Permuted Questions, Random Permuted Pairs, Randoms, Only Rhs, Random Finals)
- **Y-axis**: Accuracy (0 to 1, labeled "Accuracy")
- **Legend**: Top-right corner, blue = Prolific, orange = University students
- **Error Bars**: Vertical lines atop bars showing standard deviation
- **Significance Markers**: Red dots between bars (1 dot = p < 0.05, 2 dots = p < 0.01, 3 dots = p < 0.001)
### Detailed Analysis
1. **Defaults**:
- Prolific: 0.65 ± 0.05
- University students: 0.88 ± 0.03
- Significance: 3 dots (p < 0.001)
2. **Distracted**:
- Prolific: 0.50 ± 0.07
- University students: 0.68 ± 0.04
- Significance: 3 dots (p < 0.001)
3. **Permuted Pairs**:
- Prolific: 0.70 ± 0.04
- University students: 0.85 ± 0.03
- Significance: 3 dots (p < 0.001)
4. **Permuted Questions**:
- Prolific: 0.63 ± 0.06
- University students: 0.80 ± 0.05
- Significance: 3 dots (p < 0.001)
5. **Random Permuted Pairs**:
- Prolific: 0.45 ± 0.08
- University students: 0.72 ± 0.06
- Significance: 2 dots (p < 0.01)
6. **Randoms**:
- Prolific: 0.58 ± 0.05
- University students: 0.79 ± 0.04
- Significance: 3 dots (p < 0.001)
7. **Only Rhs**:
- Prolific: 0.74 ± 0.03
- University students: 0.88 ± 0.02
- Significance: 3 dots (p < 0.001)
8. **Random Finals**:
- Prolific: 0.60 ± 0.07
- University students: 0.48 ± 0.06
- Significance: 1 dot (p < 0.05)
### Key Observations
- **University students** consistently outperform "Prolific" in all conditions except **Random Finals**, where their accuracy drops below 0.5.
- **Prolific** shows higher variability (larger error bars) in **Distracted**, **Random Permuted Pairs**, and **Random Finals**.
- **Significance markers** indicate strong statistical differences (p < 0.001) in most conditions, except **Random Finals** (p < 0.05).
- **Only Rhs** and **Defaults** show the largest accuracy gaps (0.14–0.24 difference).
### Interpretation
The data suggests **University students** have superior accuracy across most conditions, likely due to familiarity with the task or domain-specific training. The **Random Finals** condition is an outlier, where University students' performance drops sharply, possibly due to task ambiguity or unfamiliarity. The **Prolific** group’s lower accuracy and higher variability may reflect less controlled experimental conditions or less experience. The statistical significance markers emphasize robust differences in most scenarios, though the **Random Finals** result warrants further investigation into confounding factors.