## Chart/Diagram Type: Performance Comparison Table
### Overview
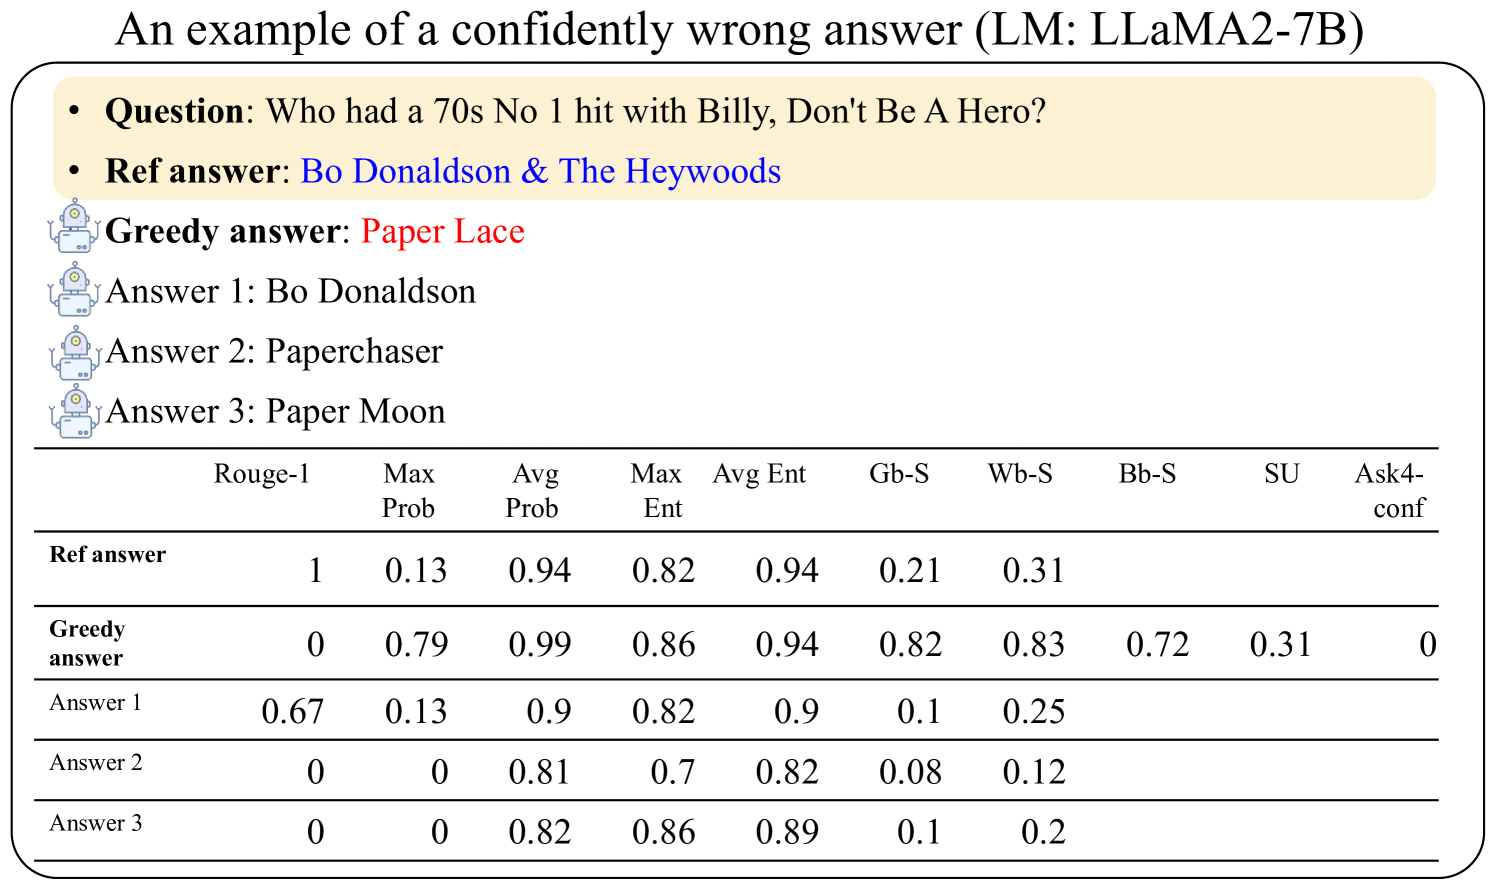
The image presents a performance comparison table for a Language Model (LLaMA2-7B) when answering the question: "Who had a 70s No 1 hit with Billy, Don't Be A Hero?". The table compares the reference answer, the greedy answer from the model, and three other possible answers generated by the model. The comparison is based on several metrics, including Rouge-1, Max Prob, Avg Prob, Max Ent, Avg Ent, Gb-S, Wb-S, Bb-S, SU, and Ask4-conf.
### Components/Axes
* **Title:** An example of a confidently wrong answer (LM: LLaMA2-7B)
* **Question:** Who had a 70s No 1 hit with Billy, Don't Be A Hero?
* **Ref answer:** Bo Donaldson & The Heywoods
* **Greedy answer:** Paper Lace
* **Answer 1:** Bo Donaldson
* **Answer 2:** Paperchaser
* **Answer 3:** Paper Moon
* **Columns:**
* Rouge-1
* Max Prob
* Avg Prob
* Max Ent
* Avg Ent
* Gb-S
* Wb-S
* Bb-S
* SU
* Ask4-conf
* **Rows:**
* Ref answer
* Greedy answer
* Answer 1
* Answer 2
* Answer 3
### Detailed Analysis or ### Content Details
The table contains the following data:
| | Rouge-1 | Max Prob | Avg Prob | Max Ent | Avg Ent | Gb-S | Wb-S | Bb-S | SU | Ask4-conf |
| :-------------------- | :------ | :------- | :------- | :------ | :------ | :--- | :--- | :--- | :--- | :-------- |
| **Ref answer** | 1 | 0.13 | 0.94 | 0.82 | 0.94 | 0.21 | 0.31 | | | |
| **Greedy answer** | 0 | 0.79 | 0.99 | 0.86 | 0.94 | 0.82 | 0.83 | 0.72 | 0.31 | 0 |
| **Answer 1** | 0.67 | 0.13 | 0.9 | 0.82 | 0.9 | 0.1 | 0.25 | | | |
| **Answer 2** | 0 | 0 | 0.81 | 0.7 | 0.82 | 0.08 | 0.12 | | | |
| **Answer 3** | 0 | 0 | 0.82 | 0.86 | 0.89 | 0.1 | 0.2 | | | |
* **Ref answer:** Rouge-1 score is 1, Max Prob is 0.13, Avg Prob is 0.94, Max Ent is 0.82, Avg Ent is 0.94, Gb-S is 0.21, and Wb-S is 0.31.
* **Greedy answer:** Rouge-1 score is 0, Max Prob is 0.79, Avg Prob is 0.99, Max Ent is 0.86, Avg Ent is 0.94, Gb-S is 0.82, Wb-S is 0.83, Bb-S is 0.72, SU is 0.31, and Ask4-conf is 0.
* **Answer 1:** Rouge-1 score is 0.67, Max Prob is 0.13, Avg Prob is 0.9, Max Ent is 0.82, Avg Ent is 0.9, Gb-S is 0.1, and Wb-S is 0.25.
* **Answer 2:** Rouge-1 score is 0, Max Prob is 0, Avg Prob is 0.81, Max Ent is 0.7, Avg Ent is 0.82, Gb-S is 0.08, and Wb-S is 0.12.
* **Answer 3:** Rouge-1 score is 0, Max Prob is 0, Avg Prob is 0.82, Max Ent is 0.86, Avg Ent is 0.89, Gb-S is 0.1, and Wb-S is 0.2.
### Key Observations
* The "Ref answer" has the highest Rouge-1 score (1), indicating the best match with the reference.
* The "Greedy answer" has a high Max Prob (0.79) and Avg Prob (0.99), but a Rouge-1 score of 0, suggesting it's confidently incorrect.
* "Answer 1" has a relatively high Rouge-1 score (0.67) compared to "Answer 2" and "Answer 3".
* "Answer 2" and "Answer 3" have Max Prob values of 0.
### Interpretation
The data demonstrates a scenario where the language model (LLaMA2-7B) provides a "confidently wrong" answer. The "Greedy answer" has high probability scores (Max Prob and Avg Prob) but fails to match the reference answer (Rouge-1 score of 0). This suggests the model is confident in its incorrect answer. The other generated answers ("Answer 1", "Answer 2", "Answer 3") also show varying degrees of accuracy, with "Answer 1" being the closest to the reference based on the Rouge-1 score. The table highlights the importance of evaluating language models not only on probability scores but also on the accuracy of their responses.