# Technical Document Extraction: RSA Model Performance Analysis
## Chart Structure Overview
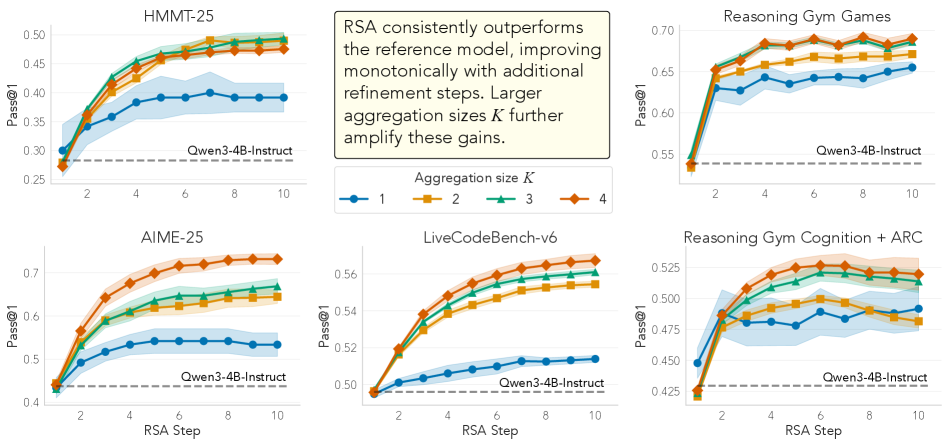
The image contains **six line charts** arranged in a 2x3 grid, each visualizing the performance of an RSA model across different datasets and aggregation sizes. Key elements include:
- **X-axis**: "RSA Step" (1–10)
- **Y-axis**: "Pass@1" metric (varying ranges per chart)
- **Lines**: Color-coded by aggregation size (K=1, 2, 3, 4)
- **Shaded Regions**: Confidence intervals for each line
- **Dashed Line**: "Owen3-4B-Instruct" baseline
---
## Legend & Color Mapping
- **Location**: Center-top of the grid
- **Colors**:
- `blue` = K=1
- `orange` = K=2
- `green` = K=3
- `red` = K=4
---
## Chart-Specific Analysis
### 1. HMMT-25
- **Y-axis Range**: 0.25–0.50
- **Trends**:
- All lines slope **upward** (K=4 > K=3 > K=2 > K=1).
- "Owen3-4B-Instruct" (dashed black) remains **below all lines**.
- **Key Data Points**:
- At RSA Step 10: K=4 ≈ 0.49, K=1 ≈ 0.39.
### 2. AIME-25
- **Y-axis Range**: 0.4–0.7
- **Trends**:
- All lines slope **upward** (K=4 > K=3 > K=2 > K=1).
- "Owen3-4B-Instruct" (dashed black) remains **below all lines**.
- **Key Data Points**:
- At RSA Step 10: K=4 ≈ 0.68, K=1 ≈ 0.52.
### 3. LiveCodeBench-v6
- **Y-axis Range**: 0.5–0.6
- **Trends**:
- All lines slope **upward** (K=4 > K=3 > K=2 > K=1).
- "Owen3-4B-Instruct" (dashed black) remains **below all lines**.
- **Key Data Points**:
- At RSA Step 10: K=4 ≈ 0.59, K=1 ≈ 0.52.
### 4. Reasoning Gym Games
- **Y-axis Range**: 0.55–0.7
- **Trends**:
- All lines slope **upward** (K=4 > K=3 > K=2 > K=1).
- "Owen3-4B-Instruct" (dashed black) remains **below all lines**.
- **Key Data Points**:
- At RSA Step 10: K=4 ≈ 0.69, K=1 ≈ 0.64.
### 5. Reasoning Gym Cognition + ARC
- **Y-axis Range**: 0.425–0.525
- **Trends**:
- All lines slope **upward** (K=4 > K=3 > K=2 > K=1).
- "Owen3-4B-Instruct" (dashed black) remains **below all lines**.
- **Key Data Points**:
- At RSA Step 10: K=4 ≈ 0.51, K=1 ≈ 0.47.
---
## Embedded Text Box (Central)