## Heatmap: Vulnerability and Mitigation Strategies
### Overview
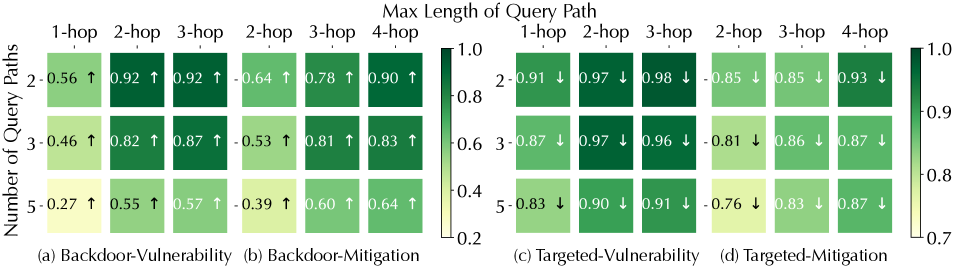
The image presents four heatmaps comparing vulnerability and mitigation strategies for backdoor and targeted attacks. The heatmaps show the relationship between the number of query paths (2, 3, and 5) and the maximum length of the query path (1-hop, 2-hop, 3-hop, and 4-hop). The color intensity represents the effectiveness, ranging from low (light yellow) to high (dark green). Arrows indicate the trend of the values.
### Components/Axes
* **Title:** Max Length of Query Path
* **Y-axis Title:** Number of Query Paths
* **Y-axis Markers:** 2, 3, 5
* **X-axis Markers:** 1-hop, 2-hop, 3-hop, 4-hop (appears twice)
* **Heatmap Titles:**
* (a) Backdoor-Vulnerability
* (b) Backdoor-Mitigation
* (c) Targeted-Vulnerability
* (d) Targeted-Mitigation
* **Color Scale:** Ranges from 0.2 (light yellow) to 1.0 (dark green). Intermediate values are 0.4, 0.6, 0.7, 0.8, 0.9.
* **Arrows:** Upward arrows (↑) indicate an increase in value, downward arrows (↓) indicate a decrease in value.
### Detailed Analysis
#### (a) Backdoor-Vulnerability
| Number of Query Paths | 1-hop | 2-hop | 3-hop |
| :-------------------- | :---- | :---- | :---- |
| 2 | 0.56 ↑ | 0.92 ↑ | 0.92 ↑ |
| 3 | 0.46 ↑ | 0.82 ↑ | 0.87 ↑ |
| 5 | 0.27 ↑ | 0.55 ↑ | 0.57 ↑ |
* **Trend:** As the number of hops increases, the vulnerability generally increases for each number of query paths.
#### (b) Backdoor-Mitigation
| Number of Query Paths | 2-hop | 3-hop | 4-hop |
| :-------------------- | :---- | :---- | :---- |
| 2 | 0.64 ↑ | 0.78 ↑ | 0.90 ↑ |
| 3 | 0.53 ↑ | 0.81 ↑ | 0.83 ↑ |
| 5 | 0.39 ↑ | 0.60 ↑ | 0.64 ↑ |
* **Trend:** As the number of hops increases, the mitigation effectiveness generally increases for each number of query paths.
#### (c) Targeted-Vulnerability
| Number of Query Paths | 1-hop | 2-hop | 3-hop |
| :-------------------- | :---- | :---- | :---- |
| 2 | 0.91 ↓ | 0.97 ↓ | 0.98 ↓ |
| 3 | 0.87 ↓ | 0.97 ↓ | 0.96 ↓ |
| 5 | 0.83 ↓ | 0.90 ↓ | 0.91 ↓ |
* **Trend:** As the number of hops increases, the vulnerability generally increases for each number of query paths.
#### (d) Targeted-Mitigation
| Number of Query Paths | 2-hop | 3-hop | 4-hop |
| :-------------------- | :---- | :---- | :---- |
| 2 | 0.85 ↓ | 0.85 ↓ | 0.93 ↓ |
| 3 | 0.81 ↓ | 0.86 ↓ | 0.87 ↓ |
| 5 | 0.76 ↓ | 0.83 ↓ | 0.87 ↓ |
* **Trend:** As the number of hops increases, the mitigation effectiveness generally increases for each number of query paths.
### Key Observations
* **Vulnerability:** Vulnerability is generally higher for targeted attacks compared to backdoor attacks.
* **Mitigation:** Mitigation effectiveness increases with the length of the query path for both backdoor and targeted attacks.
* **Number of Query Paths:** Increasing the number of query paths generally decreases the effectiveness of mitigation.
* **Arrows:** All values in the Backdoor-Vulnerability and Backdoor-Mitigation heatmaps have upward arrows, indicating an increasing trend. All values in the Targeted-Vulnerability and Targeted-Mitigation heatmaps have downward arrows, indicating a decreasing trend.
### Interpretation
The heatmaps illustrate the interplay between attack type (backdoor vs. targeted), mitigation strategies, query path length, and the number of query paths. The data suggests that targeted attacks are inherently more vulnerable, but mitigation strategies become more effective as the query path length increases. However, increasing the number of query paths can reduce the effectiveness of mitigation, highlighting a trade-off between query complexity and security. The arrows indicate the trend of the values, which is consistent with the overall pattern.