## Heatmap Matrix: Backdoor and Targeted Vulnerability/Mitigation Analysis
### Overview
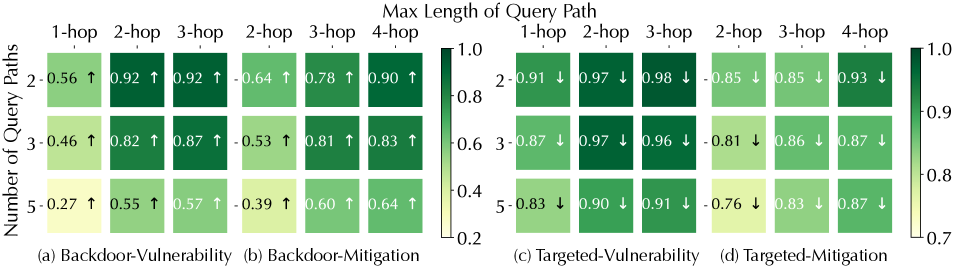
This image displays a matrix of four heatmaps, labeled (a) through (d), evaluating the performance or impact of "Backdoor" and "Targeted" scenarios under varying conditions. The vertical axis represents the "Number of Query Paths" (2, 3, 5), and the horizontal axis represents the "Max Length of Query Path" (1-hop, 2-hop, 3-hop). Each cell contains a numerical value and an arrow indicating the direction of the trend (upward or downward).
### Components/Axes
* **Horizontal Axis (Top):** "Max Length of Query Path" (1-hop, 2-hop, 3-hop). This applies to all four sub-charts.
* **Vertical Axis (Left):** "Number of Query Paths" (2, 3, 5). This applies to all four sub-charts.
* **Sub-charts:**
* **(a) Backdoor-Vulnerability:** Left-most heatmap.
* **(b) Backdoor-Mitigation:** Second heatmap from the left.
* **(c) Targeted-Vulnerability:** Third heatmap from the left.
* **(d) Targeted-Mitigation:** Right-most heatmap.
* **Legends:**
* **Left Legend (for a & b):** Scale from 0.2 (light yellow) to 1.0 (dark green).