## Heatmap: Backdoor and Targeted Attack Performance
### Overview
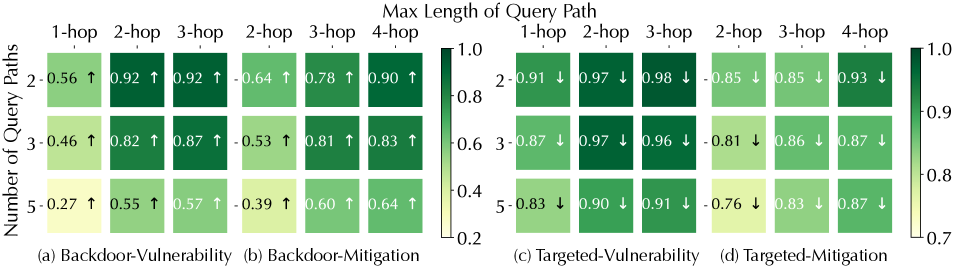
The image presents a comparative heatmap illustrating the performance of backdoor attacks and targeted attacks under different mitigation strategies, evaluated by the number of query paths and the maximum length of the query path. The heatmap displays success rates (ranging from approximately 0.2 to 1.0) using a color gradient, with darker green representing higher success rates. The image is divided into four quadrants, each representing a different attack/mitigation scenario.
### Components/Axes
* **X-axis:** "Max Length of Query Path" with markers 1-hop, 2-hop, 3-hop, and 4-hop.
* **Y-axis:** "Number of Query Paths" with markers 2, 3, and 5.
* **Quadrants:**
* (a) Backdoor-Vulnerability
* (b) Backdoor-Mitigation
* (c) Targeted-Vulnerability
* (d) Targeted-Mitigation
* **Color Scale:** A vertical color bar on the right side indicates the success rate, ranging from approximately 0.2 (light green) to 1.0 (dark green).
* **Arrows:** Upward arrows (↑) and downward arrows (↓) are embedded within the heatmap cells, indicating the trend in success rate compared to the adjacent cell in the same row.
### Detailed Analysis
The heatmap consists of 12 cells per quadrant, each displaying a success rate value.
**Quadrant (a) Backdoor-Vulnerability:**
* 1-hop, 2 Query Paths: 0.56 (↑)
* 1-hop, 3 Query Paths: 0.46 (↑)
* 1-hop, 5 Query Paths: 0.27 (↑)
* 2-hop, 2 Query Paths: 0.92 (↑)
* 2-hop, 3 Query Paths: 0.82 (↑)
* 2-hop, 5 Query Paths: 0.55 (↑)
* 3-hop, 2 Query Paths: 0.92 (↑)
* 3-hop, 3 Query Paths: 0.87 (↑)
* 3-hop, 5 Query Paths: 0.57 (↑)
* 4-hop, 2 Query Paths: 0.64 (↑)
* 4-hop, 3 Query Paths: 0.81 (↑)
* 4-hop, 5 Query Paths: 0.60 (↑)
**Quadrant (b) Backdoor-Mitigation:**
* 1-hop, 2 Query Paths: -0.64 (↑)
* 1-hop, 3 Query Paths: -0.53 (↑)
* 1-hop, 5 Query Paths: -0.39 (↑)
* 2-hop, 2 Query Paths: 0.78 (↑)
* 2-hop, 3 Query Paths: 0.81 (↑)
* 2-hop, 5 Query Paths: 0.60 (↑)
* 3-hop, 2 Query Paths: 0.90 (↑)
* 3-hop, 3 Query Paths: 0.83 (↑)
* 3-hop, 5 Query Paths: 0.64 (↑)
* 4-hop, 2 Query Paths: 0.78 (↑)
* 4-hop, 3 Query Paths: 0.86 (↑)
* 4-hop, 5 Query Paths: 0.78 (↑)
**Quadrant (c) Targeted-Vulnerability:**
* 1-hop, 2 Query Paths: 0.97 (↓)
* 1-hop, 3 Query Paths: 0.97 (↓)
* 1-hop, 5 Query Paths: 0.83 (↓)
* 2-hop, 2 Query Paths: 0.98 (↓)
* 2-hop, 3 Query Paths: 0.96 (↓)
* 2-hop, 5 Query Paths: 0.76 (↓)
* 3-hop, 2 Query Paths: 0.91 (↓)
* 3-hop, 3 Query Paths: 0.86 (↓)
* 3-hop, 5 Query Paths: 0.83 (↓)
* 4-hop, 2 Query Paths: 0.93 (↓)
* 4-hop, 3 Query Paths: 0.87 (↓)
* 4-hop, 5 Query Paths: 0.87 (↓)
**Quadrant (d) Targeted-Mitigation:**
* 1-hop, 2 Query Paths: 0.99 (↓)
* 1-hop, 3 Query Paths: 0.97 (↓)
* 1-hop, 5 Query Paths: 0.87 (↓)
* 2-hop, 2 Query Paths: 0.98 (↓)
* 2-hop, 3 Query Paths: 0.97 (↓)
* 2-hop, 5 Query Paths: 0.87 (↓)
* 3-hop, 2 Query Paths: 0.91 (↓)
* 3-hop, 3 Query Paths: 0.86 (↓)
* 3-hop, 5 Query Paths: 0.83 (↓)
* 4-hop, 2 Query Paths: 0.93 (↓)
* 4-hop, 3 Query Paths: 0.87 (↓)
* 4-hop, 5 Query Paths: 0.87 (↓)
### Key Observations
* In general, success rates tend to increase with increasing query path length for both backdoor attacks (quadrant a) and targeted attacks (quadrant c) *without* mitigation.
* Mitigation strategies (quadrants b and d) significantly reduce the success rates of both attack types, with many values becoming negative in quadrant (b).
* The downward arrows in quadrants (c) and (d) indicate that increasing the query path length *decreases* the success rate when mitigation is applied.
* Targeted attacks (quadrants c and d) generally have higher success rates than backdoor attacks, even with mitigation.
### Interpretation
The heatmap demonstrates the effectiveness of mitigation strategies in reducing the success rates of both backdoor and targeted attacks. The negative values in the "Backdoor-Mitigation" quadrant (b) suggest that the mitigation strategy may even *decrease* the success rate below a baseline, potentially by introducing false negatives or disrupting legitimate queries. The trend of decreasing success rates with longer query paths under mitigation (quadrants c and d) indicates that the mitigation strategy is more effective at preventing attacks that require longer paths to execute. The consistently higher success rates of targeted attacks, even with mitigation, suggest that these attacks are more resilient or require different mitigation approaches. The data suggests a trade-off between attack success rate and query path length, and the optimal mitigation strategy may depend on the specific attack vector and the acceptable level of disruption to legitimate queries.