## Bar Chart: Model Rate and Performance Improvement
### Overview
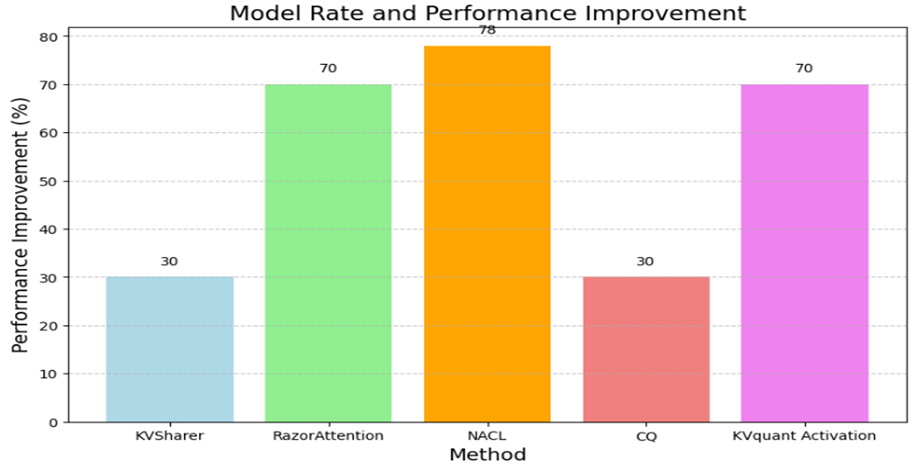
The chart compares the performance improvement (%) of five different methods: KVSharer, RazorAttention, NACL, CQ, and KVquant Activation. Performance improvement is measured on a y-axis ranging from 0% to 80%, with each method represented by a distinct colored bar.
### Components/Axes
- **X-axis (Methods)**:
- KVSharer (light blue)
- RazorAttention (green)
- NACL (orange)
- CQ (red)
- KVquant Activation (purple)
- **Y-axis (Performance Improvement)**: Labeled "Performance Improvement (%)" with ticks at 0, 10, 20, ..., 80.
- **Legend**: Located at the bottom, explicitly mapping colors to methods.
- **Title**: "Model Rate and Performance Improvement" (centered at the top).
### Detailed Analysis
- **KVSharer**: Light blue bar at 30%.
- **RazorAttention**: Green bar at 70%.
- **NACL**: Orange bar at 78% (highest value).
- **CQ**: Red bar at 30%.
- **KVquant Activation**: Purple bar at 70%.
### Key Observations
1. **NACL** achieves the highest performance improvement (78%), significantly outperforming other methods.
2. **RazorAttention** and **KVquant Activation** both show identical improvement (70%), ranking second.
3. **KVSharer** and **CQ** are tied at the lowest improvement (30%).
4. The chart exhibits a bimodal distribution: two methods (NACL, RazorAttention/KVquant Activation) dominate the upper range, while two others (KVSharer, CQ) cluster at the lower end.
### Interpretation
The data suggests significant variability in the effectiveness of the methods. NACL’s 78% improvement indicates it is the most efficient, potentially making it a preferred choice for applications prioritizing performance. RazorAttention and KVquant Activation, while slightly less effective than NACL, still outperform KVSharer and CQ by a factor of 2.3. The identical performance of RazorAttention and KVquant Activation raises questions about their underlying mechanisms—whether they are functionally equivalent or represent distinct approaches with similar outcomes. Conversely, KVSharer and CQ’s low scores may signal design flaws or suboptimal parameter tuning. This chart underscores the importance of method selection in optimizing model performance, with NACL emerging as the clear leader.