\n
## Box Plot: Number of Goals Comparison
### Overview
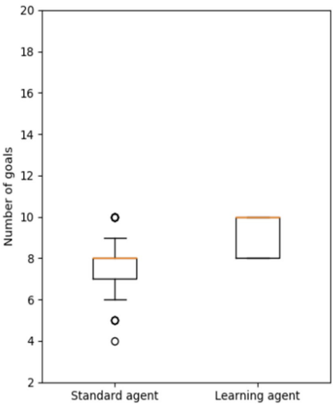
The image presents a box plot comparing the number of goals achieved by a "Standard agent" and a "Learning agent". The plot displays the distribution of goal counts for each agent type, including median, quartiles, and outliers.
### Components/Axes
* **X-axis:** Agent Type - with categories "Standard agent" and "Learning agent".
* **Y-axis:** Number of goals - Scale ranges from 2 to 20, with increments of 2.
* **Box Plots:** Two box plots, one for each agent type.
* **Outliers:** Represented by individual circles ("o").
### Detailed Analysis
**Standard Agent:**
The box plot for the Standard agent shows a median value of approximately 8. The lower quartile is around 6, and the upper quartile is around 9. The interquartile range (IQR) is approximately 3. There are three outliers: one at approximately 3, one at approximately 4, and one at approximately 5.
**Learning Agent:**
The box plot for the Learning agent shows a median value of approximately 9.5. The lower quartile is around 8.5, and the upper quartile is around 10.5. The IQR is approximately 2. There are no outliers visible for the Learning agent.
### Key Observations
* The Learning agent generally achieves a higher number of goals than the Standard agent, as indicated by the higher median.
* The distribution of goal counts for the Learning agent is more concentrated (smaller IQR) than for the Standard agent.
* The Standard agent has several outliers with significantly lower goal counts, suggesting greater variability in performance.
### Interpretation
The data suggests that the Learning agent is more effective at achieving goals compared to the Standard agent. The higher median and smaller IQR indicate that the Learning agent consistently achieves a higher number of goals with less variability. The presence of outliers for the Standard agent suggests that its performance is more prone to fluctuations, with some instances resulting in significantly lower goal counts. This could be due to the Learning agent's ability to adapt and improve its strategy over time, while the Standard agent operates with a fixed approach. The absence of outliers for the Learning agent suggests a more robust and reliable performance. The difference in the distributions suggests that the learning agent is more consistent in its performance.