## Box Plot: Goal Achievement Comparison Between Standard and Learning Agents
### Overview
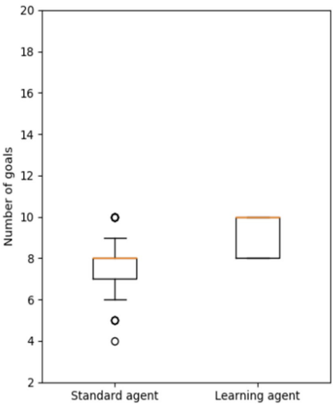
The image displays a vertical box plot comparing the "Number of goals" achieved by two types of agents: a "Standard agent" and a "Learning agent." The chart is presented on a plain white background with black axes and labels. The plot uses standard box-and-whisker notation to show the distribution of data for each category.
### Components/Axes
* **Chart Type:** Box Plot (Box-and-Whisker Plot).
* **Y-Axis:**
* **Label:** "Number of goals"
* **Scale:** Linear, ranging from 2 to 20.
* **Major Tick Marks:** At intervals of 2 (2, 4, 6, 8, 10, 12, 14, 16, 18, 20).
* **X-Axis:**
* **Categories:** Two discrete categories are labeled.
* **Left Category:** "Standard agent"
* **Right Category:** "Learning agent"
* **Legend:** Not present. The two data series are distinguished solely by their position on the x-axis.
* **Visual Elements:** Each agent's data is represented by a box (interquartile range) with a central line (median), whiskers (range excluding outliers), and individual circles (outliers). The boxes and whiskers are black outlines. The median line within each box is orange.
### Detailed Analysis
**1. Standard Agent (Left Box Plot):**
* **Median (Orange Line):** Approximately 8 goals.
* **Interquartile Range (IQR - The Box):** Spans from approximately 7 goals (25th percentile) to 8 goals (75th percentile).
* **Whiskers:**
* Lower Whisker extends down to approximately 6 goals.
* Upper Whisker extends up to approximately 9 goals.
* **Outliers (Individual Circles):** Three distinct outliers are visible.
* One at approximately 4 goals.
* One at approximately 5 goals.
* One at approximately 10 goals.
* **Overall Range (including outliers):** From ~4 to ~10 goals.
**2. Learning Agent (Right Box Plot):**
* **Median (Orange Line):** Approximately 10 goals.
* **Interquartile Range (IQR - The Box):** Spans from approximately 8 goals (25th percentile) to 10 goals (75th percentile).
* **Whiskers:** No whiskers are visible extending from the box. This suggests the minimum and maximum values (excluding outliers) are at the 25th and 75th percentiles, or that the data is concentrated within the IQR.
* **Outliers:** No outlier circles are plotted for this agent.
* **Overall Range (visible):** From ~8 to ~10 goals.
### Key Observations
* **Central Tendency:** The Learning agent has a higher median number of goals (10) compared to the Standard agent (8).
* **Spread & Variability:** The Standard agent shows significantly greater variability in performance. Its data spans a wider range (4-10 goals) and includes multiple outliers. The Learning agent's performance is more consistent and concentrated within a narrower band (8-10 goals).
* **Performance Floor:** The lowest recorded performance for the Standard agent (~4 goals) is substantially lower than the lowest performance for the Learning agent (~8 goals).
* **Performance Ceiling:** The highest non-outlier performance for the Standard agent (~9 goals) is lower than the median performance of the Learning agent (~10 goals).
### Interpretation
The data suggests a clear performance advantage for the "Learning agent" over the "Standard agent" in the context of achieving goals.
* **Effectiveness:** The Learning agent not only achieves a higher typical number of goals (median of 10 vs. 8) but also demonstrates a higher minimum performance level. This indicates it is both more effective on average and more reliable, avoiding the very low scores seen in the Standard agent.
* **Consistency:** The tight IQR and lack of outliers for the Learning agent point to highly consistent and predictable performance. In contrast, the Standard agent's performance is erratic, with results scattered widely and several instances of notably poor performance (outliers at 4 and 5 goals).
* **Implication:** The "learning" mechanism appears to successfully improve both the average outcome and the stability of the agent's performance. It elevates the floor of performance, making failure (very low goal counts) much less likely. The Standard agent, while capable of reaching 9-10 goals, is prone to significant underperformance.
**Note on Uncertainty:** Exact numerical values are approximated based on visual alignment with the y-axis tick marks, as no gridlines or data labels are provided on the plot itself. The analysis is based on the relative positions and standard interpretation of box plot elements.