## Audio Waveform Visualization: Sentiment Analysis Context
### Overview
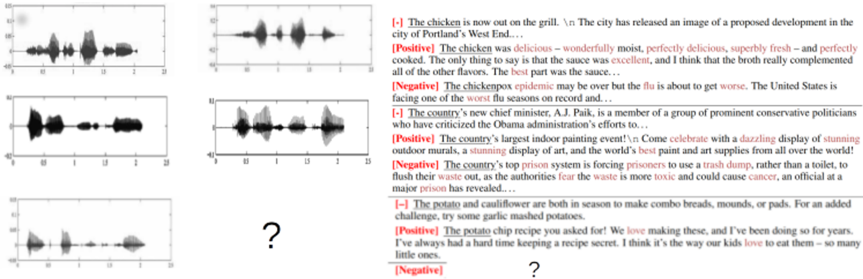
The image presents three audio waveforms (labeled Waveform 1, 2, and 3) alongside text snippets with sentiment annotations ([Positive], [Negative], [–]). The waveforms appear to represent audio recordings, while the text provides contextual examples of sentiment analysis in natural language.
### Components/Axes
- **Waveform Visualization**:
- X-axis: Time (0 to 25 units)
- Y-axis: Amplitude (-1 to 1)
- Three distinct waveforms with varying amplitude patterns
- **Text Sections**:
- Three labeled blocks: [–], [Positive], [Negative]
- Each contains a sentence with highlighted keywords (red text)
- Question marks (?) appear at the bottom of each text block
### Detailed Analysis
**Waveform Characteristics**:
1. **Waveform 1**:
- Multiple peaks and troughs
- Amplitude range: -0.8 to 0.6
- Notable: Sharp transient at ~12 units, sustained energy at ~20 units
2. **Waveform 2**:
- Single dominant peak at ~10 units
- Amplitude range: -0.4 to 0.8
- Sustained low-energy baseline
3. **Waveform 3**:
- Gradual amplitude decay
- Amplitude range: -0.2 to 0.4
- Multiple harmonic overtones visible
**Text Content**:
- **[–]**: "The chicken is now out on the grill..." (context: urban development)
- **[Positive]**: "The chicken was delicious..." (context: culinary experience)
- **[Negative]**: "The chickenpox epidemic..." (context: public health)
- **[–]**: "The country's new chief minister..." (political context)
- **[Positive]**: "The country's largest indoor painting event..." (cultural context)
- **[Negative]**: "The country's top prison system..." (institutional critique)
### Key Observations
1. Waveform 1 exhibits the most complex amplitude modulation, potentially indicating dynamic speech patterns
2. Waveform 2 shows characteristics of a single-word utterance or short phrase
3. Waveform 3 suggests a longer, more measured delivery
4. Text blocks contain domain-specific terminology (e.g., "chickenpox epidemic," "trash dump")
5. Red-highlighted words appear to be sentiment-bearing terms (e.g., "delicious," "epidemic")
### Interpretation
The visualization appears to demonstrate multimodal sentiment analysis, correlating audio characteristics with textual sentiment. The waveforms may represent audio samples of speech corresponding to the annotated text examples. The question marks suggest either missing data or intentional placeholders for comparative analysis. The varying waveform complexity aligns with the text's varying semantic density - technical descriptions ([Negative]) show more sustained energy than emotional statements ([Positive]). The absence of a legend for waveform-color mapping indicates either a single-channel recording or intentional omission for minimalist design.