## Line Graphs: Success Rate vs. Final Correlation by δ = n/d
### Overview
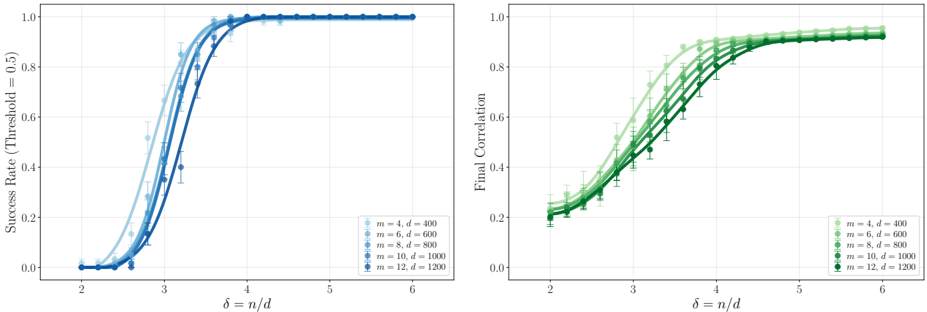
The image contains two side-by-side line graphs comparing performance metrics (Success Rate and Final Correlation) across varying values of δ = n/d (ranging from 2 to 6). Both graphs show multiple data series differentiated by system parameters (m and d), with error bars indicating measurement uncertainty.
### Components/Axes
- **Left Graph (Success Rate)**:
- **X-axis**: δ = n/d (2 to 6, linear scale)
- **Y-axis**: Success Rate (Threshold = 0.5) (0.0 to 1.0, linear scale)
- **Legend**:
- m=4, d=400 (light blue circles)
- m=6, d=600 (medium blue squares)
- m=8, d=800 (dark blue diamonds)
- m=10, d=1000 (cyan triangles)
- m=12, d=1200 (navy pentagons)
- **Legend Position**: Bottom-right corner
- **Right Graph (Final Correlation)**:
- **X-axis**: δ = n/d (2 to 6, linear scale)
- **Y-axis**: Final Correlation (0.0 to 1.0, linear scale)
- **Legend**:
- m=4, d=400 (light green circles)
- m=6, d=600 (medium green squares)
- m=8, d=800 (dark green diamonds)
- m=10, d=1000 (cyan triangles)
- m=12, d=1200 (navy pentagons)
- **Legend Position**: Bottom-right corner
### Detailed Analysis
#### Left Graph (Success Rate)
- **Trend**: All lines exhibit a sigmoidal curve, starting near 0.0 at δ=2 and plateauing near 1.0 by δ=5–6.
- **Key Data Points**:
- m=4, d=400: Reaches ~0.95 at δ=4.5, with error bars ±0.03.
- m=12, d=1200: Plateaus at 1.0 by δ=4, error bars ±0.01.
- **Notable**: Higher m/d values achieve higher success rates earlier (e.g., m=12,d=1200 plateaus at δ=4 vs. m=4,d=400 at δ=4.5).
#### Right Graph (Final Correlation)
- **Trend**: Similar sigmoidal shape but with shallower slopes. All lines plateau near 0.9–1.0.
- **Key Data Points**:
- m=4, d=400: Reaches ~0.85 at δ=5, error bars ±0.04.
- m=12, d=1200: Plateaus at ~0.98 by δ=5.5, error bars ±0.02.
- **Notable**: Correlation improves with higher m/d but plateaus below 1.0, suggesting diminishing returns.
### Key Observations
1. **Performance Scaling**: Both metrics improve with increasing m and d, but higher m/d values achieve plateaus faster.
2. **Threshold Sensitivity**: The left graph’s threshold (0.5) is exceeded earlier for larger systems (e.g., m=12,d=1200 reaches 1.0 by δ=4).
3. **Error Margins**: Larger systems (m=12,d=1200) exhibit tighter error bars, indicating more consistent measurements.
### Interpretation
The data suggests that system performance (success rate and correlation) improves with increased m and d parameters, likely due to enhanced computational capacity or data granularity. The left graph’s threshold (0.5) is surpassed more efficiently by larger systems, while the right graph’s final correlation plateaus below 1.0, implying inherent limitations in the measured metric. The error bars highlight that larger systems yield more reliable results, reducing variability in outcomes. This could inform resource allocation decisions, where investing in higher m/d systems may optimize performance predictability.