\n
## Bar Chart with Line Overlay: R1-Llama Performance vs. KV Budget
### Overview
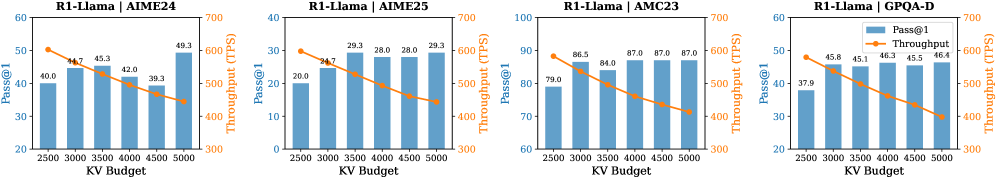
The image presents four bar charts, each displaying the relationship between "Pass@1" and "Throughput (TPS)" for the R1-Llama model across different KV Budgets. Each chart corresponds to a specific accelerator: AIME24, AIME25, AMC23, and GPQA-D. The charts show how Pass@1 changes with increasing KV Budget, while a line graph overlays the corresponding Throughput values.
### Components/Axes
* **X-axis:** KV Budget (ranging from 2500 to 4500, with increments of 500).
* **Y-axis (Left):** Pass@1 (ranging from approximately 20 to 100, depending on the accelerator).
* **Y-axis (Right):** Throughput (TPS) (ranging from approximately 300 to 700).
* **Bar Color:** Light Blue, representing Pass@1.
* **Line Color:** Orange, representing Throughput.
* **Legend:**
* Pass@1 (Light Blue)
* Throughput (Orange)
* **Titles:** Each chart is titled "R1-Llama | [Accelerator Name]".
### Detailed Analysis or Content Details
**1. R1-Llama | AIME24**
* **Trend (Pass@1):** The Pass@1 values generally increase with increasing KV Budget.
* **Data Points (Pass@1):**
* KV Budget 2500: Approximately 40.0
* KV Budget 3000: Approximately 44.7
* KV Budget 3500: Approximately 45.3
* KV Budget 4000: Approximately 39.3
* KV Budget 4500: Approximately 49.3
* **Trend (Throughput):** The Throughput values decrease with increasing KV Budget.
* **Data Points (Throughput):**
* KV Budget 2500: Approximately 650 TPS
* KV Budget 3000: Approximately 600 TPS
* KV Budget 3500: Approximately 550 TPS
* KV Budget 4000: Approximately 500 TPS
* KV Budget 4500: Approximately 450 TPS
**2. R1-Llama | AIME25**
* **Trend (Pass@1):** Pass@1 values show a slight increase initially, then plateau and slightly decrease with increasing KV Budget.
* **Data Points (Pass@1):**
* KV Budget 2500: Approximately 26.0
* KV Budget 3000: Approximately 29.3
* KV Budget 3500: Approximately 28.0
* KV Budget 4000: Approximately 26.0
* KV Budget 4500: Approximately 25.3
* **Trend (Throughput):** Throughput decreases with increasing KV Budget.
* **Data Points (Throughput):**
* KV Budget 2500: Approximately 600 TPS
* KV Budget 3000: Approximately 550 TPS
* KV Budget 3500: Approximately 500 TPS
* KV Budget 4000: Approximately 450 TPS
* KV Budget 4500: Approximately 400 TPS
**3. R1-Llama | AMC23**
* **Trend (Pass@1):** Pass@1 values decrease significantly with increasing KV Budget.
* **Data Points (Pass@1):**
* KV Budget 2500: Approximately 90.3
* KV Budget 3000: Approximately 79.0
* KV Budget 3500: Approximately 84.0
* KV Budget 4000: Approximately 87.0
* KV Budget 4500: Approximately 87.0
* **Trend (Throughput):** Throughput decreases with increasing KV Budget.
* **Data Points (Throughput):**
* KV Budget 2500: Approximately 700 TPS
* KV Budget 3000: Approximately 600 TPS
* KV Budget 3500: Approximately 500 TPS
* KV Budget 4000: Approximately 400 TPS
* KV Budget 4500: Approximately 300 TPS
**4. R1-Llama | GPQA-D**
* **Trend (Pass@1):** Pass@1 values generally increase with increasing KV Budget.
* **Data Points (Pass@1):**
* KV Budget 2500: Approximately 37.9
* KV Budget 3000: Approximately 45.8
* KV Budget 3500: Approximately 45.1
* KV Budget 4000: Approximately 45.5
* KV Budget 4500: Approximately 46.4
* **Trend (Throughput):** Throughput decreases with increasing KV Budget.
* **Data Points (Throughput):**
* KV Budget 2500: Approximately 600 TPS
* KV Budget 3000: Approximately 550 TPS
* KV Budget 3500: Approximately 500 TPS
* KV Budget 4000: Approximately 450 TPS
* KV Budget 4500: Approximately 400 TPS
### Key Observations
* There's a consistent inverse relationship between Pass@1 and Throughput across all accelerators. Increasing KV Budget generally improves Pass@1 but reduces Throughput.
* AMC23 starts with the highest Pass@1 but experiences a significant drop as KV Budget increases.
* AIME25 has the lowest overall Pass@1 values.
* AIME24 and GPQA-D show a more consistent increase in Pass@1 with increasing KV Budget.
### Interpretation
The data suggests a trade-off between accuracy (Pass@1) and speed (Throughput) when adjusting the KV Budget for the R1-Llama model. Higher KV Budgets appear to prioritize accuracy at the expense of processing speed. The varying performance across different accelerators (AIME24, AIME25, AMC23, GPQA-D) indicates that the optimal KV Budget will depend on the specific hardware being used and the desired balance between accuracy and throughput. The significant drop in Pass@1 for AMC23 with increasing KV Budget could indicate a hardware-specific limitation or an interaction between the model and the accelerator. The consistent inverse relationship between the two metrics suggests a fundamental constraint in the system's performance. Further investigation is needed to understand the underlying reasons for these trends and to optimize the KV Budget for each accelerator to achieve the best possible performance.