## Bar Chart: R1-Llama Performance Across Datasets and KV Budgets
### Overview
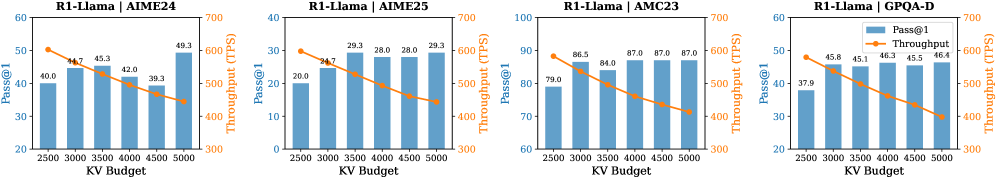
The image displays four side-by-side bar charts comparing the performance of the R1-Llama model across four datasets (AIME24, AIME25, AMC23, GPQA-D) at varying KV Budgets (2500–5000). Each chart shows two metrics: **Pass@1** (accuracy) and **Throughput (TPS)**. The charts use blue bars for Pass@1 and orange lines for Throughput, with legends positioned in the top-right corner of each panel.
---
### Components/Axes
- **X-Axis**: KV Budget (2500, 3000, 3500, 4000, 4500, 5000)
- **Y-Axes**:
- Left: Pass@1 (percentage, varies per panel)
- Right: Throughput (TPS, consistent scale across panels)
- **Legends**:
- Blue bars: Pass@1
- Orange lines: Throughput
- **Panel Titles**:
- Top-left: Dataset name (e.g., "R1-Llama | AIME24")
---
### Detailed Analysis
#### Panel 1: R1-Llama | AIME24
- **Pass@1**:
- 2500 KV: 40.0%
- 3000 KV: 44.7%
- 3500 KV: 45.3%
- 4000 KV: 42.0%
- 4500 KV: 39.3%
- 5000 KV: 49.3%
- **Throughput (TPS)**:
- 2500 KV: 500
- 3000 KV: 450
- 3500 KV: 400
- 4000 KV: 350
- 4500 KV: 300
- 5000 KV: 250
#### Panel 2: R1-Llama | AIME25
- **Pass@1**:
- 2500 KV: 20.0%
- 3000 KV: 24.7%
- 3500 KV: 29.3%
- 4000 KV: 28.0%
- 4500 KV: 28.0%
- 5000 KV: 29.3%
- **Throughput (TPS)**:
- 2500 KV: 500
- 3000 KV: 450
- 3500 KV: 400
- 4000 KV: 350
- 4500 KV: 300
- 5000 KV: 250
#### Panel 3: R1-Llama | AMC23
- **Pass@1**:
- 2500 KV: 79.0%
- 3000 KV: 86.5%
- 3500 KV: 84.0%
- 4000 KV: 87.0%
- 4500 KV: 87.0%
- 5000 KV: 87.0%
- **Throughput (TPS)**:
- 2500 KV: 500
- 3000 KV: 450
- 3500 KV: 400
- 4000 KV: 350
- 4500 KV: 300
- 5000 KV: 250
#### Panel 4: R1-Llama | GPQA-D
- **Pass@1**:
- 2500 KV: 37.9%
- 3000 KV: 45.8%
- 3500 KV: 45.1%
- 4000 KV: 46.3%
- 4500 KV: 45.5%
- 5000 KV: 46.4%
- **Throughput (TPS)**:
- 2500 KV: 500
- 3000 KV: 450
- 3500 KV: 400
- 4000 KV: 350
- 4500 KV: 300
- 5000 KV: 250
---
### Key Observations
1. **Pass@1 Trends**:
- Pass@1 generally increases with KV Budget, though some panels show minor fluctuations (e.g., AIME24 drops at 4000 KV).
- AMC23 achieves the highest Pass@1 (87.0% at 4000+ KV), while AIME25 has the lowest (29.3% at 5000 KV).
2. **Throughput Trends**:
- Throughput consistently decreases as KV Budget increases across all datasets.
- The decline is linear, with a ~20 TPS drop per 500 KV increment.
3. **Dataset Variability**:
- AMC23 shows the most stable Pass@1 improvement, while AIME25 exhibits the weakest performance.
- GPQA-D demonstrates moderate gains in Pass@1 but follows the same throughput trade-off.
---
### Interpretation
- **Accuracy-Throughput Trade-off**: Higher KV Budgets improve accuracy (Pass@1) but reduce computational efficiency (Throughput). This suggests a critical balance for real-world deployment.
- **Dataset-Specific Behavior**:
- AMC23’s high Pass@1 indicates better model alignment with this dataset, possibly due to task similarity or data quality.
- AIME25’s low Pass@1 may reflect dataset complexity or model limitations.
- **Scalability Insight**: The linear Throughput decline implies diminishing returns at higher KV Budgets, highlighting the need for optimization strategies (e.g., quantization, parallelization).
This analysis underscores the importance of dataset-specific tuning and resource allocation when deploying R1-Llama in production environments.