## Diagram: Mechanistic Interpretability of Antonym Resolution in GPT-2
### Overview
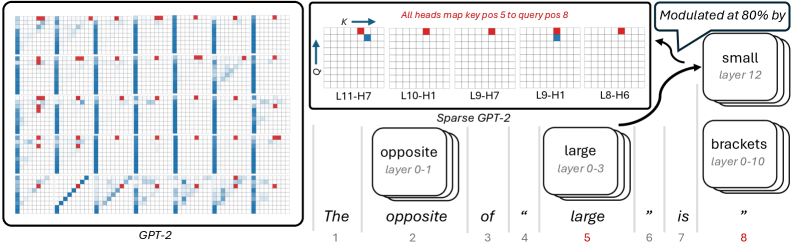
This image is a technical diagram illustrating how a transformer-based language model (specifically comparing standard GPT-2 to a "Sparse GPT-2" concept) processes a specific sequence of text to predict an antonym. The left side displays a dense grid of attention maps from standard GPT-2. The right side isolates specific components (attention heads and feature layers) in a "Sparse GPT-2" architecture to demonstrate how the model logically deduces that the opposite of "large" is "small".
### Components/Axes
* **Left Panel (GPT-2):** A 6x6 grid of individual attention matrices. No explicit axes are labeled, but standard convention implies Query (Q) vs. Key (K) token positions.
* **Top-Right Panel (Attention Heads):**
* **Y-Axis:** Labeled **Q** (Query) with an upward-pointing arrow.
* **X-Axis:** Labeled **K** (Key) with a right-pointing arrow.
* **Labels:** Five specific attention heads are identified: **L11-H7**, **L10-H1**, **L9-H7**, **L9-H1**, **L8-H6** (where L = Layer, H = Head).
* **Bottom-Right Panel (Sequence & Features):**
* **Text Sequence:** A tokenized sentence with corresponding position indices (1 through 8).
* **Feature Blocks:** Stacked rounded rectangles representing activated concepts/features at specific layers (e.g., "opposite layer 0-1").
### Detailed Analysis
#### 1. Left Panel: Standard GPT-2 Attention
* **Position:** Left half of the image, enclosed in a black border.
* **Label:** "GPT-2" centered at the bottom.
* **Visuals:** 36 individual attention maps arranged in a 6x6 grid.
* **Trends:** The maps show dense, complex attention patterns.
* Dark blue squares indicate high attention weights.
* Many maps show strong vertical blue lines (attention focused on a single past token across all current queries).
* Some maps show diagonal blue lines (attention to the immediately preceding token).
* Red squares are scattered throughout, highlighting specific attention points, but they are buried within the dense blue noise.
#### 2. Top-Right Panel: Isolated Attention Heads
* **Position:** Top right, enclosed in a black border.
* **Header Text (Red):** "All heads map key pos 5 to query pos 8"
* **Visuals:** Five isolated 8x8 grid attention maps.
* **Data Points:**
* In *every* one of the five grids, there is a distinct **red square** located at the exact coordinate of **K=5, Q=8** (5th column from the left, 8th row from the bottom).
* Grids L11-H7 and L9-H1 also contain a single blue square immediately below the red square (at K=5, Q=7).
* The rest of the grid cells are empty/white, demonstrating "sparsity" compared to the dense left panel.
#### 3. Bottom-Right Panel: Sequence and Feature Flow
* **Position:** Bottom right.
* **Label:** "Sparse GPT-2" located above the sequence.
* **Sequence Table:**
| Position | 1 | 2 | 3 | 4 | 5 (Red) | 6 | 7 | 8 (Red) |
| :--- | :--- | :--- | :--- | :--- | :--- | :--- | :--- | :--- |
| **Token** | The | opposite | of | " | large | " | is | " |
* **Feature Blocks (Spatial Grounding):**
* Positioned above token 2 ("opposite"): A block labeled **opposite** (subtext: *layer 0-1*).
* Positioned above token 5 ("large"): A block labeled **large** (subtext: *layer 0-3*).
* Positioned to the far right (top): A block labeled **small** (subtext: *layer 12*).
* Positioned to the far right (bottom): A block labeled **brackets** (subtext: *layer 0-10*).
* **Annotations & Flow:**
* Two curved black arrows originate from the Top-Right Panel (the isolated attention heads) and point directly to the **small** feature block.
* A speech bubble points to the arrows/small block containing the text: "**Modulated at 80% by**".
### Key Observations
1. **Color-Coded Correlation:** There is a direct, critical link established by the color red. In the text sequence, position **5** ("large") and position **8** (the final quotation mark) are colored red. This perfectly corresponds to the red text "key pos 5 to query pos 8" and the red squares plotted at coordinates (5, 8) in the isolated attention heads.
2. **Information Routing:** The diagram explicitly shows that specific attention heads in middle-to-late layers (Layers 8, 9, 10, 11) are responsible for looking back from the current position (8) to a specific past position (5).
3. **Dense vs. Sparse:** The left panel illustrates how difficult it is to see this specific mechanism in a standard, fully dense model. The right panel strips away the noise to show the exact sub-network performing the task.
### Interpretation
This diagram is a classic example of **Mechanistic Interpretability** in Large Language Models. It attempts to reverse-engineer *how* a model arrives at a specific output.
* **The Task:** The model is given the prompt: `The opposite of " large " is "` and must predict the next token. The correct logical answer is "small".
* **The Mechanism:**
1. Early layers identify the core concepts: "opposite" (layers 0-1) and "large" (layers 0-3).
2. When the model reaches position 8 (the final quote, where it must make its prediction), it needs to know *what* it is finding the opposite of.
3. A specific circuit of attention heads (L11-H7, L10-H1, L9-H7, L9-H1, L8-H6) activates. Their sole job in this context is to route information from position 5 ("large") to the current position 8.
4. This routed information ("large") interacts with the previously established context ("opposite").
5. This interaction heavily modulates (at 80% influence) the activation of the final output feature: the concept of **"small"** at the final layer (layer 12).
* **Conclusion:** The diagram proves that the model isn't just guessing; it has formed a specific, identifiable neural circuit to perform antonym resolution. By making the model "sparse" (isolating these specific heads and features), researchers can map the exact flow of logic from the prompt to the generated output.