## Forest Plot: Pressure Field vs Baselines (Easy Difficulty)
### Overview
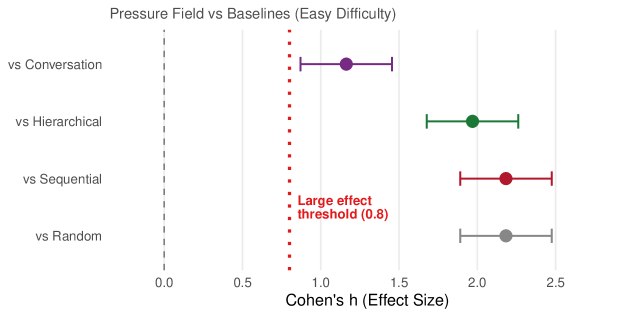
The image is a forest plot comparing the effect size (Cohen's h) of a "Pressure Field" condition against four different baselines: Conversation, Hierarchical, Sequential, and Random. The plot visualizes the effect size and confidence intervals for each comparison, with a vertical dotted line indicating a "Large effect threshold" at 0.8.
### Components/Axes
* **Title:** Pressure Field vs Baselines (Easy Difficulty)
* **X-axis:** Cohen's h (Effect Size), ranging from 0.0 to 2.5 in increments of 0.5.
* **Y-axis:** Categorical labels representing the baselines: vs Conversation, vs Hierarchical, vs Sequential, vs Random.
* **Large effect threshold:** A vertical dotted red line at x = 0.8, labeled "Large effect threshold (0.8)".
* **Data Points:** Each baseline comparison is represented by a colored dot indicating the mean effect size, with a horizontal line extending from each side of the dot representing the confidence interval.
* vs Conversation: Purple dot with purple error bar.
* vs Hierarchical: Green dot with green error bar.
* vs Sequential: Red dot with red error bar.
* vs Random: Gray dot with gray error bar.
### Detailed Analysis
* **vs Conversation (Purple):** The effect size is approximately 1.1, with a confidence interval ranging from approximately 0.8 to 1.4.
* Trend: The effect size is above the "Large effect threshold".
* **vs Hierarchical (Green):** The effect size is approximately 1.8, with a confidence interval ranging from approximately 1.5 to 2.1.
* Trend: The effect size is above the "Large effect threshold".
* **vs Sequential (Red):** The effect size is approximately 2.0, with a confidence interval ranging from approximately 1.7 to 2.3.
* Trend: The effect size is above the "Large effect threshold".
* **vs Random (Gray):** The effect size is approximately 2.0, with a confidence interval ranging from approximately 1.7 to 2.3.
* Trend: The effect size is above the "Large effect threshold".
### Key Observations
* All four baseline comparisons have effect sizes above the "Large effect threshold" of 0.8.
* The "vs Random" and "vs Sequential" comparisons have the highest effect sizes, both centered around 2.0.
* The "vs Conversation" comparison has the lowest effect size, centered around 1.1.
### Interpretation
The forest plot suggests that the "Pressure Field" condition has a large effect compared to all four baselines (Conversation, Hierarchical, Sequential, and Random) under "Easy Difficulty". The effect is most pronounced when compared to "Sequential" and "Random" baselines, indicating that the "Pressure Field" condition differs substantially from these approaches. The "Conversation" baseline shows the smallest, but still significant, effect size, suggesting it is the most similar to the "Pressure Field" condition among the baselines tested. The fact that all effect sizes exceed the 0.8 threshold indicates a practically significant difference between the "Pressure Field" and each baseline.