\n
## Forest Plot: Pressure Field vs Baselines (Easy Difficulty)
### Overview
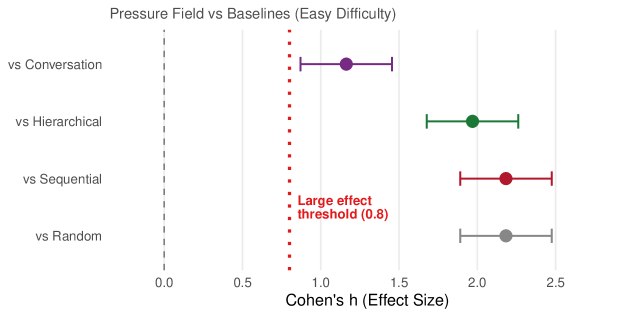
The image presents a forest plot comparing the "Pressure Field" against four baseline conditions ("Conversation", "Hierarchical", "Sequential", and "Random") in terms of effect size, specifically Cohen's h. Each baseline condition is represented by a point estimate and a 95% confidence interval, visualized as horizontal error bars. A vertical dashed line indicates a threshold for a "large effect" (0.8).
### Components/Axes
* **Title:** "Pressure Field vs Baselines (Easy Difficulty)" - positioned at the top-center.
* **Y-axis:** Labels the comparison conditions: "vs Conversation", "vs Hierarchical", "vs Sequential", "vs Random" - positioned on the left. No numerical scale is present.
* **X-axis:** "Cohen's h (Effect Size)" - ranging from approximately 0.0 to 2.5.
* **Large effect threshold:** A vertical dashed red line at approximately 1.0, labeled "Large effect threshold (0.8)".
* **Data Points:** Each baseline condition is represented by a colored dot (point estimate) with a horizontal error bar (95% confidence interval).
* **Legend:** No explicit legend is present, but the colors are associated with the baseline conditions.
### Detailed Analysis
The plot shows the following approximate effect sizes (Cohen's h) and confidence intervals:
* **vs Conversation (Purple):** Point estimate at approximately 1.2, with a 95% confidence interval ranging from approximately 0.8 to 1.6.
* **vs Hierarchical (Green):** Point estimate at approximately 1.8, with a 95% confidence interval ranging from approximately 1.4 to 2.2.
* **vs Sequential (Red):** Point estimate at approximately 2.2, with a 95% confidence interval ranging from approximately 1.8 to 2.6.
* **vs Random (Grey):** Point estimate at approximately 2.0, with a 95% confidence interval ranging from approximately 1.6 to 2.4.
All four conditions show positive effect sizes, and their confidence intervals do not cross the "Large effect threshold" line at 1.0.
### Key Observations
* All comparisons demonstrate a large effect size, as indicated by the confidence intervals being entirely to the right of the 1.0 threshold.
* The "vs Sequential" condition exhibits the largest point estimate (approximately 2.2), suggesting the strongest effect.
* The "vs Conversation" condition has the smallest point estimate (approximately 1.2), but still represents a large effect.
* The confidence intervals for all conditions overlap to some extent, indicating some uncertainty in the precise effect sizes.
### Interpretation
The data suggests that the "Pressure Field" condition consistently outperforms all four baseline conditions ("Conversation", "Hierarchical", "Sequential", and "Random") in terms of effect size, and that these differences are statistically significant (as indicated by the large effect sizes and non-overlapping confidence intervals with the threshold). The largest effect is observed when comparing the "Pressure Field" to the "Sequential" baseline. This implies that the "Pressure Field" is particularly effective when contrasted with a sequential presentation of information. The consistent large effect sizes across all baselines suggest a robust advantage for the "Pressure Field" approach, even under varying baseline conditions. The "Easy Difficulty" label in the title suggests that these findings may not generalize to more challenging tasks. Further investigation would be needed to determine if these effects hold true under different difficulty levels.