## Forest Plot: Pressure Field vs Baselines (Easy Difficulty)
### Overview
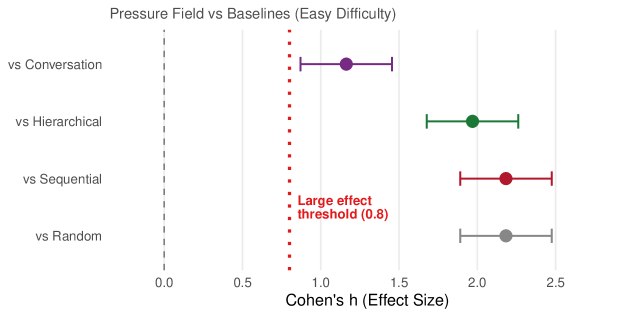
This image is a forest plot (effect size plot) comparing the performance of a method called "Pressure Field" against four different baseline methods in an "Easy Difficulty" task. The plot visualizes the effect size (Cohen's h) for each comparison, including point estimates and confidence intervals. All comparisons show a positive effect size favoring Pressure Field.
### Components/Axes
* **Chart Title:** "Pressure Field vs Baselines (Easy Difficulty)"
* **X-Axis:**
* **Label:** "Cohen's h (Effect Size)"
* **Scale:** Linear scale from 0.0 to 2.5.
* **Markers:** Major tick marks at 0.0, 0.5, 1.0, 1.5, 2.0, 2.5.
* **Y-Axis (Categories):** Lists the four baseline comparisons. From top to bottom:
1. "vs Conversation"
2. "vs Hierarchical"
3. "vs Sequential"
4. "vs Random"
* **Reference Lines:**
* A vertical **gray dashed line** at x = 0.0, representing no effect.
* A vertical **red dotted line** at x = 0.8, annotated with the text "Large effect threshold (0.8)".
* **Data Series:** Each comparison is represented by a colored point (the point estimate) with horizontal error bars (the confidence interval).
* **vs Conversation:** Purple point and error bars.
* **vs Hierarchical:** Green point and error bars.
* **vs Sequential:** Red point and error bars.
* **vs Random:** Gray point and error bars.
### Detailed Analysis
The plot presents the following effect size estimates (Cohen's h) for Pressure Field versus each baseline. Values are approximate based on visual inspection of the chart.
1. **vs Conversation (Purple):**
* **Trend:** The point estimate is clearly to the right of the large effect threshold (0.8).
* **Point Estimate:** ~1.2
* **Confidence Interval:** Spans from approximately 0.9 to 1.5.
2. **vs Hierarchical (Green):**
* **Trend:** Shows a very large effect size, well beyond the threshold.
* **Point Estimate:** ~2.0
* **Confidence Interval:** Spans from approximately 1.7 to 2.3.
3. **vs Sequential (Red):**
* **Trend:** Exhibits the largest point estimate among the four comparisons.
* **Point Estimate:** ~2.2
* **Confidence Interval:** Spans from approximately 1.9 to 2.5.
4. **vs Random (Gray):**
* **Trend:** Also shows a very large effect size.
* **Point Estimate:** ~2.1
* **Confidence Interval:** Spans from approximately 1.8 to 2.4.
### Key Observations
* **Universal Large Effect:** All four point estimates and their entire confidence intervals lie to the right of the "Large effect threshold (0.8)" line. This indicates that Pressure Field demonstrates a statistically and practically significant improvement over every baseline method in the easy difficulty setting.
* **Magnitude of Effect:** The effect sizes are substantial, ranging from approximately 1.2 to 2.2. In the context of Cohen's h, values above 0.8 are considered large, and values around 2.0 are very large.
* **Relative Performance:** The effect size is smallest when comparing to the "Conversation" baseline (~1.2) and largest when comparing to the "Sequential" baseline (~2.2). The effects against "Hierarchical" and "Random" are very similar and large (~2.0-2.1).
* **Precision:** The confidence intervals for "vs Conversation" appear slightly narrower than the others, suggesting a more precise estimate for that comparison. All intervals are of moderate width, indicating reasonable certainty in the estimated effect sizes.
### Interpretation
This forest plot provides strong, quantitative evidence that the "Pressure Field" method significantly outperforms a range of alternative approaches (Conversation, Hierarchical, Sequential, and Random) on an easy-difficulty task. The data suggests:
1. **Robust Superiority:** Pressure Field's advantage is not limited to a single type of baseline; it is consistently and substantially better across different comparison points.
2. **Practical Significance:** The effect sizes are not just statistically significant (as implied by confidence intervals not crossing zero) but are also large in a practical sense, exceeding the conventional threshold for a "large effect." This implies the performance difference is meaningful and likely observable in real-world applications of the task.
3. **Insight into Baselines:** The varying effect sizes hint at the relative difficulty of the baselines. The smallest effect against "Conversation" might suggest it is the strongest or most similar baseline to Pressure Field among those tested. The very large effects against "Sequential" and "Random" indicate these are much weaker approaches for this specific easy task.
4. **Conclusion:** For the "Easy Difficulty" scenario, adopting the Pressure Field method over any of the presented baselines would be expected to yield a major improvement in performance. The chart effectively communicates the strength and consistency of this advantage.