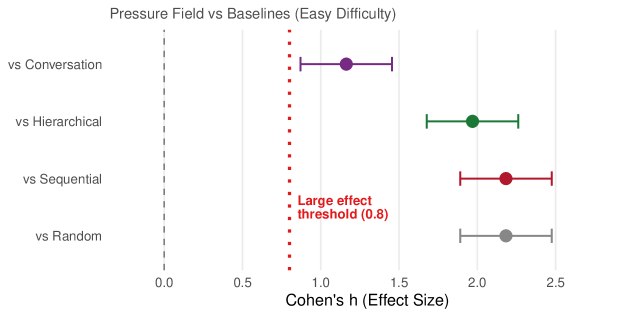
## Horizontal Bar Chart: Pressure Field vs Baselines (Easy Difficulty)
### Overview
The chart compares the effect sizes (Cohen’s h) of a "Pressure Field" intervention against four baseline conditions: "vs Conversation," "vs Hierarchical," "vs Sequential," and "vs Random." The x-axis represents Cohen’s h (Effect Size), ranging from 0.0 to 2.5, while the y-axis lists the baseline conditions. A red dotted vertical line at 0.8 marks the "Large effect threshold." Error bars indicate variability in effect sizes.
---
### Components/Axes
- **X-axis**: "Cohen’s h (Effect Size)" (0.0 to 2.5, linear scale).
- **Y-axis**: Baseline conditions (categorical, left-aligned):
- vs Conversation
- vs Hierarchical
- vs Sequential
- vs Random
- **Legend**: Located on the right, associating colors with baselines:
- Purple: vs Conversation
- Green: vs Hierarchical
- Red: vs Sequential
- Gray: vs Random
- **Threshold**: Red dotted line at x = 0.8 labeled "Large effect threshold (0.8)."
---
### Detailed Analysis
1. **vs Conversation** (Purple):
- Effect size: 1.2 ± 0.15
- Position: Leftmost data point, above the threshold line.
2. **vs Hierarchical** (Green):
- Effect size: 1.8 ± 0.10
- Position: Second from the right, above the threshold.
3. **vs Sequential** (Red):
- Effect size: 2.1 ± 0.12
- Position: Rightmost data point, highest effect size.
4. **vs Random** (Gray):
- Effect size: 2.0 ± 0.20
- Position: Third from the right, above the threshold.
---
### Key Observations
- All baselines exceed the "Large effect threshold" (0.8), indicating statistically significant effects.
- **vs Sequential** has the largest effect size (2.1), followed by **vs Random** (2.0) and **vs Hierarchical** (1.8).
- **vs Conversation** has the smallest effect size (1.2) but still surpasses the threshold.
- Error bars vary: **vs Random** has the largest uncertainty (±0.20), while **vs Hierarchical** has the smallest (±0.10).
---
### Interpretation
The chart demonstrates that the "Pressure Field" intervention produces large, statistically significant effects across all baseline conditions. The **vs Sequential** condition shows the strongest effect, suggesting it may be the most responsive to the intervention. The **vs Random** condition, despite having a high effect size (2.0), exhibits greater variability (±0.20), indicating potential instability in its measurement or implementation. The consistent surpassing of the 0.8 threshold across all baselines implies the intervention’s robustness, but the differing error margins highlight the need for further investigation into the reliability of specific conditions (e.g., **vs Random**). The red dotted threshold line serves as a critical benchmark, emphasizing that even the weakest effect (**vs Conversation**) meets the criteria for a "large effect."