\n
## Chart: Distribution of Libraries in a Dataset
### Overview
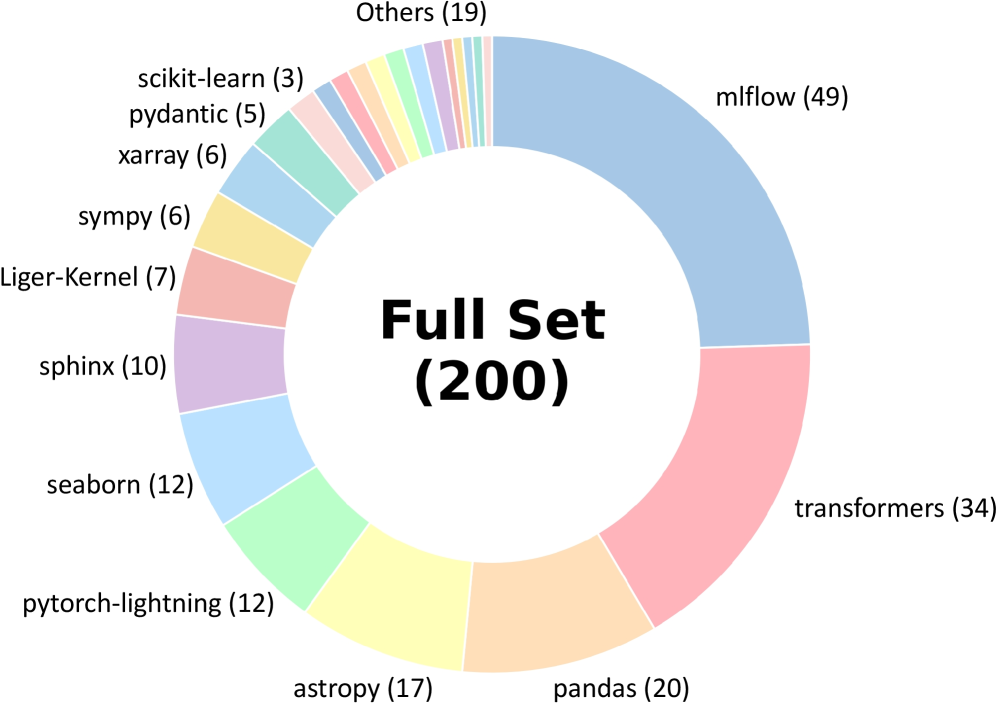
The image presents a donut chart illustrating the distribution of different Python libraries within a dataset of 200 items. The chart visually represents the proportion of each library contributing to the overall dataset.
### Components/Axes
The chart consists of a central area displaying "Full Set (200)" and a surrounding ring divided into segments, each representing a different library. Labels are positioned adjacent to each segment, indicating the library name and its corresponding count. A legend is not explicitly present, as the labels are directly attached to the segments.
### Detailed Analysis
The chart segments and their corresponding counts are as follows:
* **mlflow:** 49 (Light Blue segment, occupying the largest portion of the donut)
* **transformers:** 34 (Pink segment, second largest)
* **pandas:** 20 (Salmon segment)
* **astropy:** 17 (Yellow segment)
* **pytorch-lightning:** 12 (Light Green segment)
* **seaborn:** 12 (Aqua segment)
* **sphinx:** 10 (Blue segment)
* **Liger-Kernel:** 7 (Orange segment)
* **sympy:** 6 (Dark Yellow segment)
* **xarray:** 6 (Gray segment)
* **pydantic:** 5 (Light Orange segment)
* **scikit-learn:** 3 (Light Gray segment)
* **Others:** 19 (Multiple thin segments of various colors, positioned between scikit-learn and mlflow)
The segments are arranged in a clockwise manner, starting with "Others" at the top and proceeding through the listed libraries. The size of each segment is proportional to its count.
### Key Observations
* **mlflow** is the most prevalent library, representing approximately 24.5% of the dataset (49/200).
* **transformers** is the second most frequent library, accounting for 17% of the dataset (34/200).
* The "Others" category, while representing a significant number (19), is distributed across many libraries, resulting in a smaller visual representation.
* Several libraries have similar counts (12, 10, 6, 6), indicating a moderate level of usage.
* **scikit-learn** has the lowest count among the individually listed libraries.
### Interpretation
The chart suggests a strong focus on machine learning and data science workflows within the dataset. The prominence of **mlflow** indicates a significant emphasis on experiment tracking, model management, and deployment. The presence of **transformers** suggests a focus on natural language processing or related tasks. **pandas** and **astropy** indicate data manipulation and scientific computing are also important aspects. The "Others" category suggests a diverse range of additional libraries are used, but none individually reach the same level of prevalence as the top libraries. The distribution highlights the specific tools and technologies utilized within the context of this dataset, potentially representing a particular project, research area, or organization's technology stack. The chart provides a snapshot of the library dependencies and the relative importance of each within the overall dataset.