## Pie Chart: Full Set (200)
### Overview
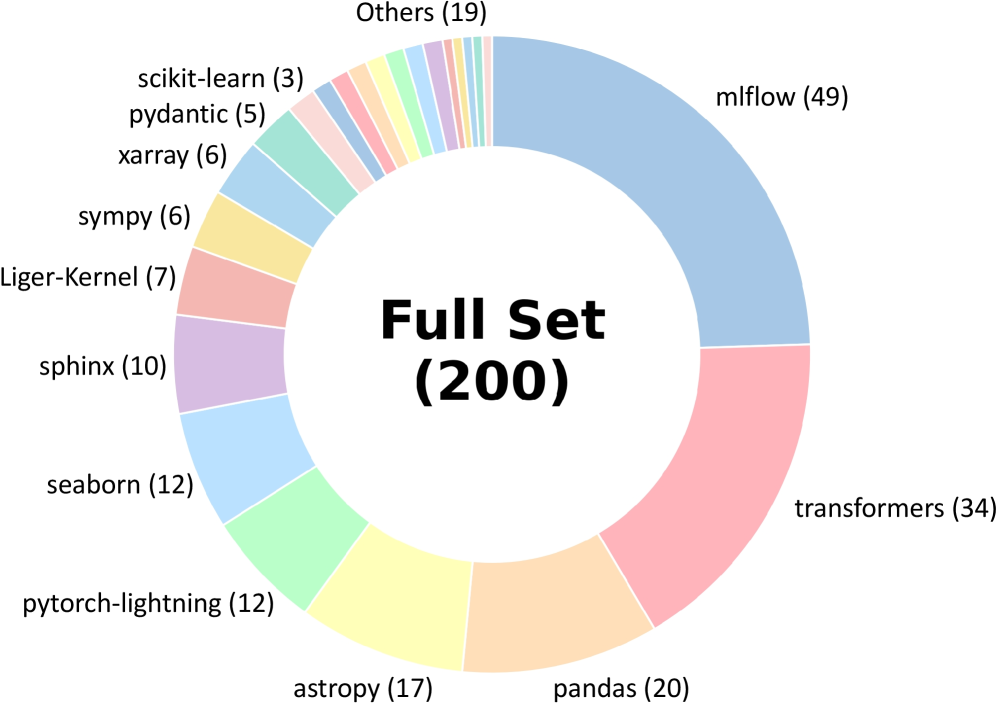
A circular pie chart titled "Full Set (200)" displays the distribution of 200 items across 14 categories, with one aggregated "Others" category. The chart uses distinct colors for each slice, with labels and counts provided.
### Components/Axes
- **Legend**: Located at the top, listing categories with colors and counts:
- mlflow (49)
- transformers (34)
- pandas (20)
- astropy (17)
- pytorch-lightning (12)
- seaborne (12)
- sphinx (10)
- Liger-Kernel (7)
- sympy (6)
- xarray (6)
- pydantic (5)
- scikit-learn (3)
- Others (19)
- **Slices**:
- Each category occupies a proportional segment of the pie.
- "Others" is a single slice representing 19 items.
### Detailed Analysis
- **mlflow**: 49 items (24.5% of total).
- **transformers**: 34 items (17%).
- **pandas**: 20 items (10%).
- **astropy**: 17 items (8.5%).
- **pytorch-lightning**: 12 items (6%).
- **seaborne**: 12 items (6%).
- **sphinx**: 10 items (5%).
- **Liger-Kernel**: 7 items (3.5%).
- **sympy**: 6 items (3%).
- **xarray**: 6 items (3%).
- **pydantic**: 5 items (2.5%).
- **scikit-learn**: 3 items (1.5%).
- **Others**: 19 items (9.5%).
### Key Observations
1. **Dominance of mlflow and transformers**: These two categories account for 41.5% of the total, making them the most prevalent.
2. **Mid-sized categories**: pandas (10%), astropy (8.5%), and pytorch-lightning/seaborne (6% each) form the next tier.
3. **Smaller slices**: Liger-Kernel (3.5%), sympy (3%), xarray (3%), pydantic (2.5%), and scikit-learn (1.5%) represent niche tools.
4. **Aggregated "Others"**: 9.5% of the total, indicating a significant portion of smaller, less frequent categories.
### Interpretation
The chart reveals a **hierarchical distribution** where a few tools (mlflow, transformers, pandas) dominate usage, while many smaller tools contribute minimally. The "Others" category, though not the largest, highlights the diversity of the dataset. This suggests a **long-tail distribution** common in ecosystems with both widely adopted and niche tools. The aggregation of "Others" may obscure specific trends in smaller categories, but it emphasizes the breadth of the dataset.