\n
## Diagram: PowerPC 450 Simulator Architecture
### Overview
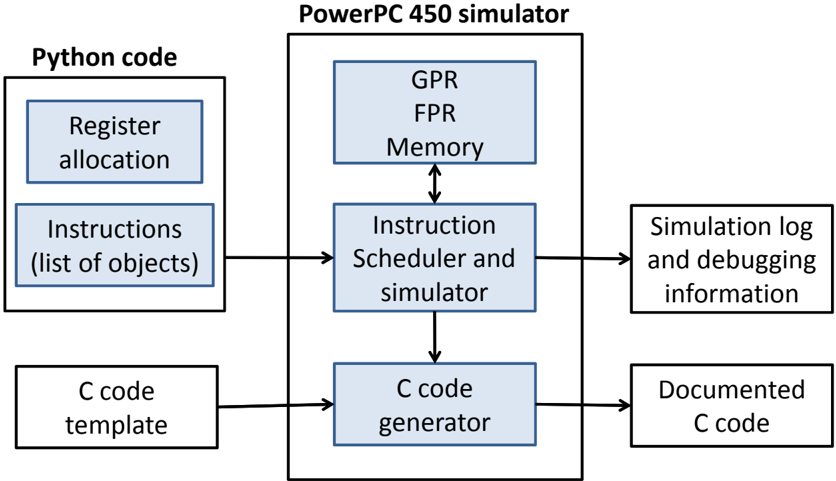
The image depicts a block diagram illustrating the architecture of a PowerPC 450 simulator. The diagram shows the flow of data and control between different components, starting with Python code and culminating in documented C code and simulation logs. The diagram is divided into two main sections: the input side (Python code) and the simulator itself (PowerPC 450 simulator).
### Components/Axes
The diagram consists of the following components:
* **Python code:** This section contains two components:
* Register allocation
* Instructions (list of objects)
* **PowerPC 450 simulator:** This is the central block, containing:
* GPR (General Purpose Registers)
* FPR (Floating Point Registers)
* Memory
* Instruction Scheduler and simulator
* C code generator
* **Output:** This section contains two components:
* Simulation log and debugging information
* Documented C code
* **C code template:** This is an input to the C code generator.
Arrows indicate the direction of data flow between these components.
### Detailed Analysis / Content Details
The diagram shows the following data flow:
1. **Python code** (Register allocation and Instructions) feeds into the **Instruction Scheduler and simulator** within the PowerPC 450 simulator.
2. The **Instruction Scheduler and simulator** interacts with **GPR**, **FPR**, and **Memory** (represented as a nested block within the simulator). There is bidirectional flow between the Instruction Scheduler and Memory.
3. The **Instruction Scheduler and simulator** outputs to the **C code generator**.
4. The **C code generator** also receives input from a **C code template**.
5. The **C code generator** outputs **Documented C code**.
6. The **Instruction Scheduler and simulator** also outputs **Simulation log and debugging information**.
The components within the PowerPC 450 simulator (GPR, FPR, Memory) are visually grouped together, suggesting they form a core functional unit. The arrows indicate a sequential processing flow, where Python code is translated into instructions, simulated, and then converted into C code.
### Key Observations
The diagram highlights the key stages of the simulation process: instruction scheduling, simulation, and code generation. The inclusion of a C code template suggests that the generated C code is based on a predefined structure. The output of simulation logs and debugging information indicates that the simulator provides tools for analyzing and understanding the simulation process.
### Interpretation
This diagram illustrates a software architecture for simulating a PowerPC 450 processor. The use of Python as an input language suggests a high-level scripting approach for defining the simulation parameters and instructions. The simulator itself appears to be implemented in a combination of hardware-like components (GPR, FPR, Memory) and software modules (Instruction Scheduler, C code generator). The generation of C code as an output suggests that the simulator can be used to translate PowerPC 450 instructions into a more portable and executable format. The simulation logs and debugging information are crucial for verifying the correctness and performance of the simulation.
The diagram suggests a layered approach to simulation, where high-level Python code is translated into low-level instructions, simulated on a virtual processor, and then converted into C code for further analysis or execution. This architecture allows for flexibility in defining the simulation environment and provides tools for debugging and understanding the simulation process. The diagram does not provide any quantitative data or performance metrics, but it clearly outlines the functional components and data flow of the PowerPC 450 simulator.