## Pyramid Diagram: Memory Hierarchy Energy Consumption
### Overview
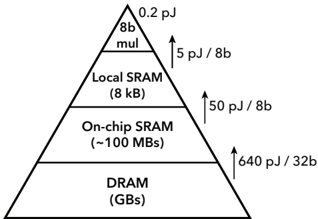
The image depicts a hierarchical pyramid diagram illustrating energy consumption across different memory technologies. The pyramid is divided into four tiers, with energy costs increasing exponentially from the top (smallest memory) to the bottom (largest memory). Arrows between tiers quantify the energy required to access or transfer data between memory levels.
### Components/Axes
- **Vertical Axis**: Energy consumption (pJ) per bit/byte, labeled with incremental values (0.2 pJ, 5 pJ/8b, 50 pJ/8b, 640 pJ/32b).
- **Horizontal Tiers**: Memory types and capacities:
- Top tier: "8b mul" (0.2 pJ)
- Second tier: "Local SRAM (8 kB)" with arrow labeled "5 pJ / 8b"
- Third tier: "On-chip SRAM (~100 MBs)" with arrow labeled "50 pJ / 8b"
- Bottom tier: "DRAM (GBs)" with arrow labeled "640 pJ / 32b"
- **Legend**: Implicitly defined by tier colors (not explicitly labeled; diagram uses black-and-white shading).
### Detailed Analysis
1. **8b mul**:
- Energy: 0.2 pJ (explicitly labeled).
- Position: Topmost tier, smallest memory footprint.
2. **Local SRAM (8 kB)**:
- Energy: 5 pJ per 8 bits (arrow label).
- Position: Second tier, 8 kB capacity.
3. **On-chip SRAM (~100 MBs)**:
- Energy: 50 pJ per 8 bits (arrow label).
- Position: Third tier, ~100 MB capacity.
4. **DRAM (GBs)**:
- Energy: 640 pJ per 32 bits (arrow label).
- Position: Bottom tier, largest capacity (GBs).
### Key Observations
- **Exponential Energy Scaling**: Energy per bit/byte increases by orders of magnitude as memory size grows:
- 8b mul → Local SRAM: 25× increase (0.2 pJ → 5 pJ/8b).
- Local SRAM → On-chip SRAM: 10× increase (5 pJ/8b → 50 pJ/8b).
- On-chip SRAM → DRAM: 12.8× increase (50 pJ/8b → 640 pJ/32b).
- **Capacity vs. Efficiency Trade-off**: Larger memory capacities (e.g., DRAM) exhibit significantly higher energy costs per unit of data.
- **Uncertainty**: On-chip SRAM capacity is approximate ("~100 MBs"), suggesting variability in real-world implementations.
### Interpretation
The diagram highlights the **energy efficiency hierarchy** in memory systems. Smaller, faster memory (e.g., 8b mul) is vastly more energy-efficient than larger, slower memory (e.g., DRAM). This reflects the **memory wall** challenge in computing, where data movement between tiers dominates system power consumption. The pyramid structure visually emphasizes that optimizing for capacity (e.g., using DRAM) incurs prohibitive energy costs, while smaller, on-chip memory (e.g., Local SRAM) balances efficiency and performance. The ~100 MB on-chip SRAM tier likely represents a practical compromise for modern processors, aligning with typical L3 cache sizes. The absence of explicit color in the diagram simplifies interpretation but limits direct comparison to color-coded legends common in multi-series charts.